> ## Documentation Index
> Fetch the complete documentation index at: https://docs.partnero.com/llms.txt
> Use this file to discover all available pages before exploring further.
# Analytics: Partner performance
Understand which affiliates deliver results and why. **Partner Performance** goes beyond top-line numbers. It provides cohort analysis by sign-up month, segmentation by partner tags, acquisition trends, and a ranked list of your top-performing affiliates.
To access, open your program, click on **Analytics**, and switch to the **Partner performance** tab: 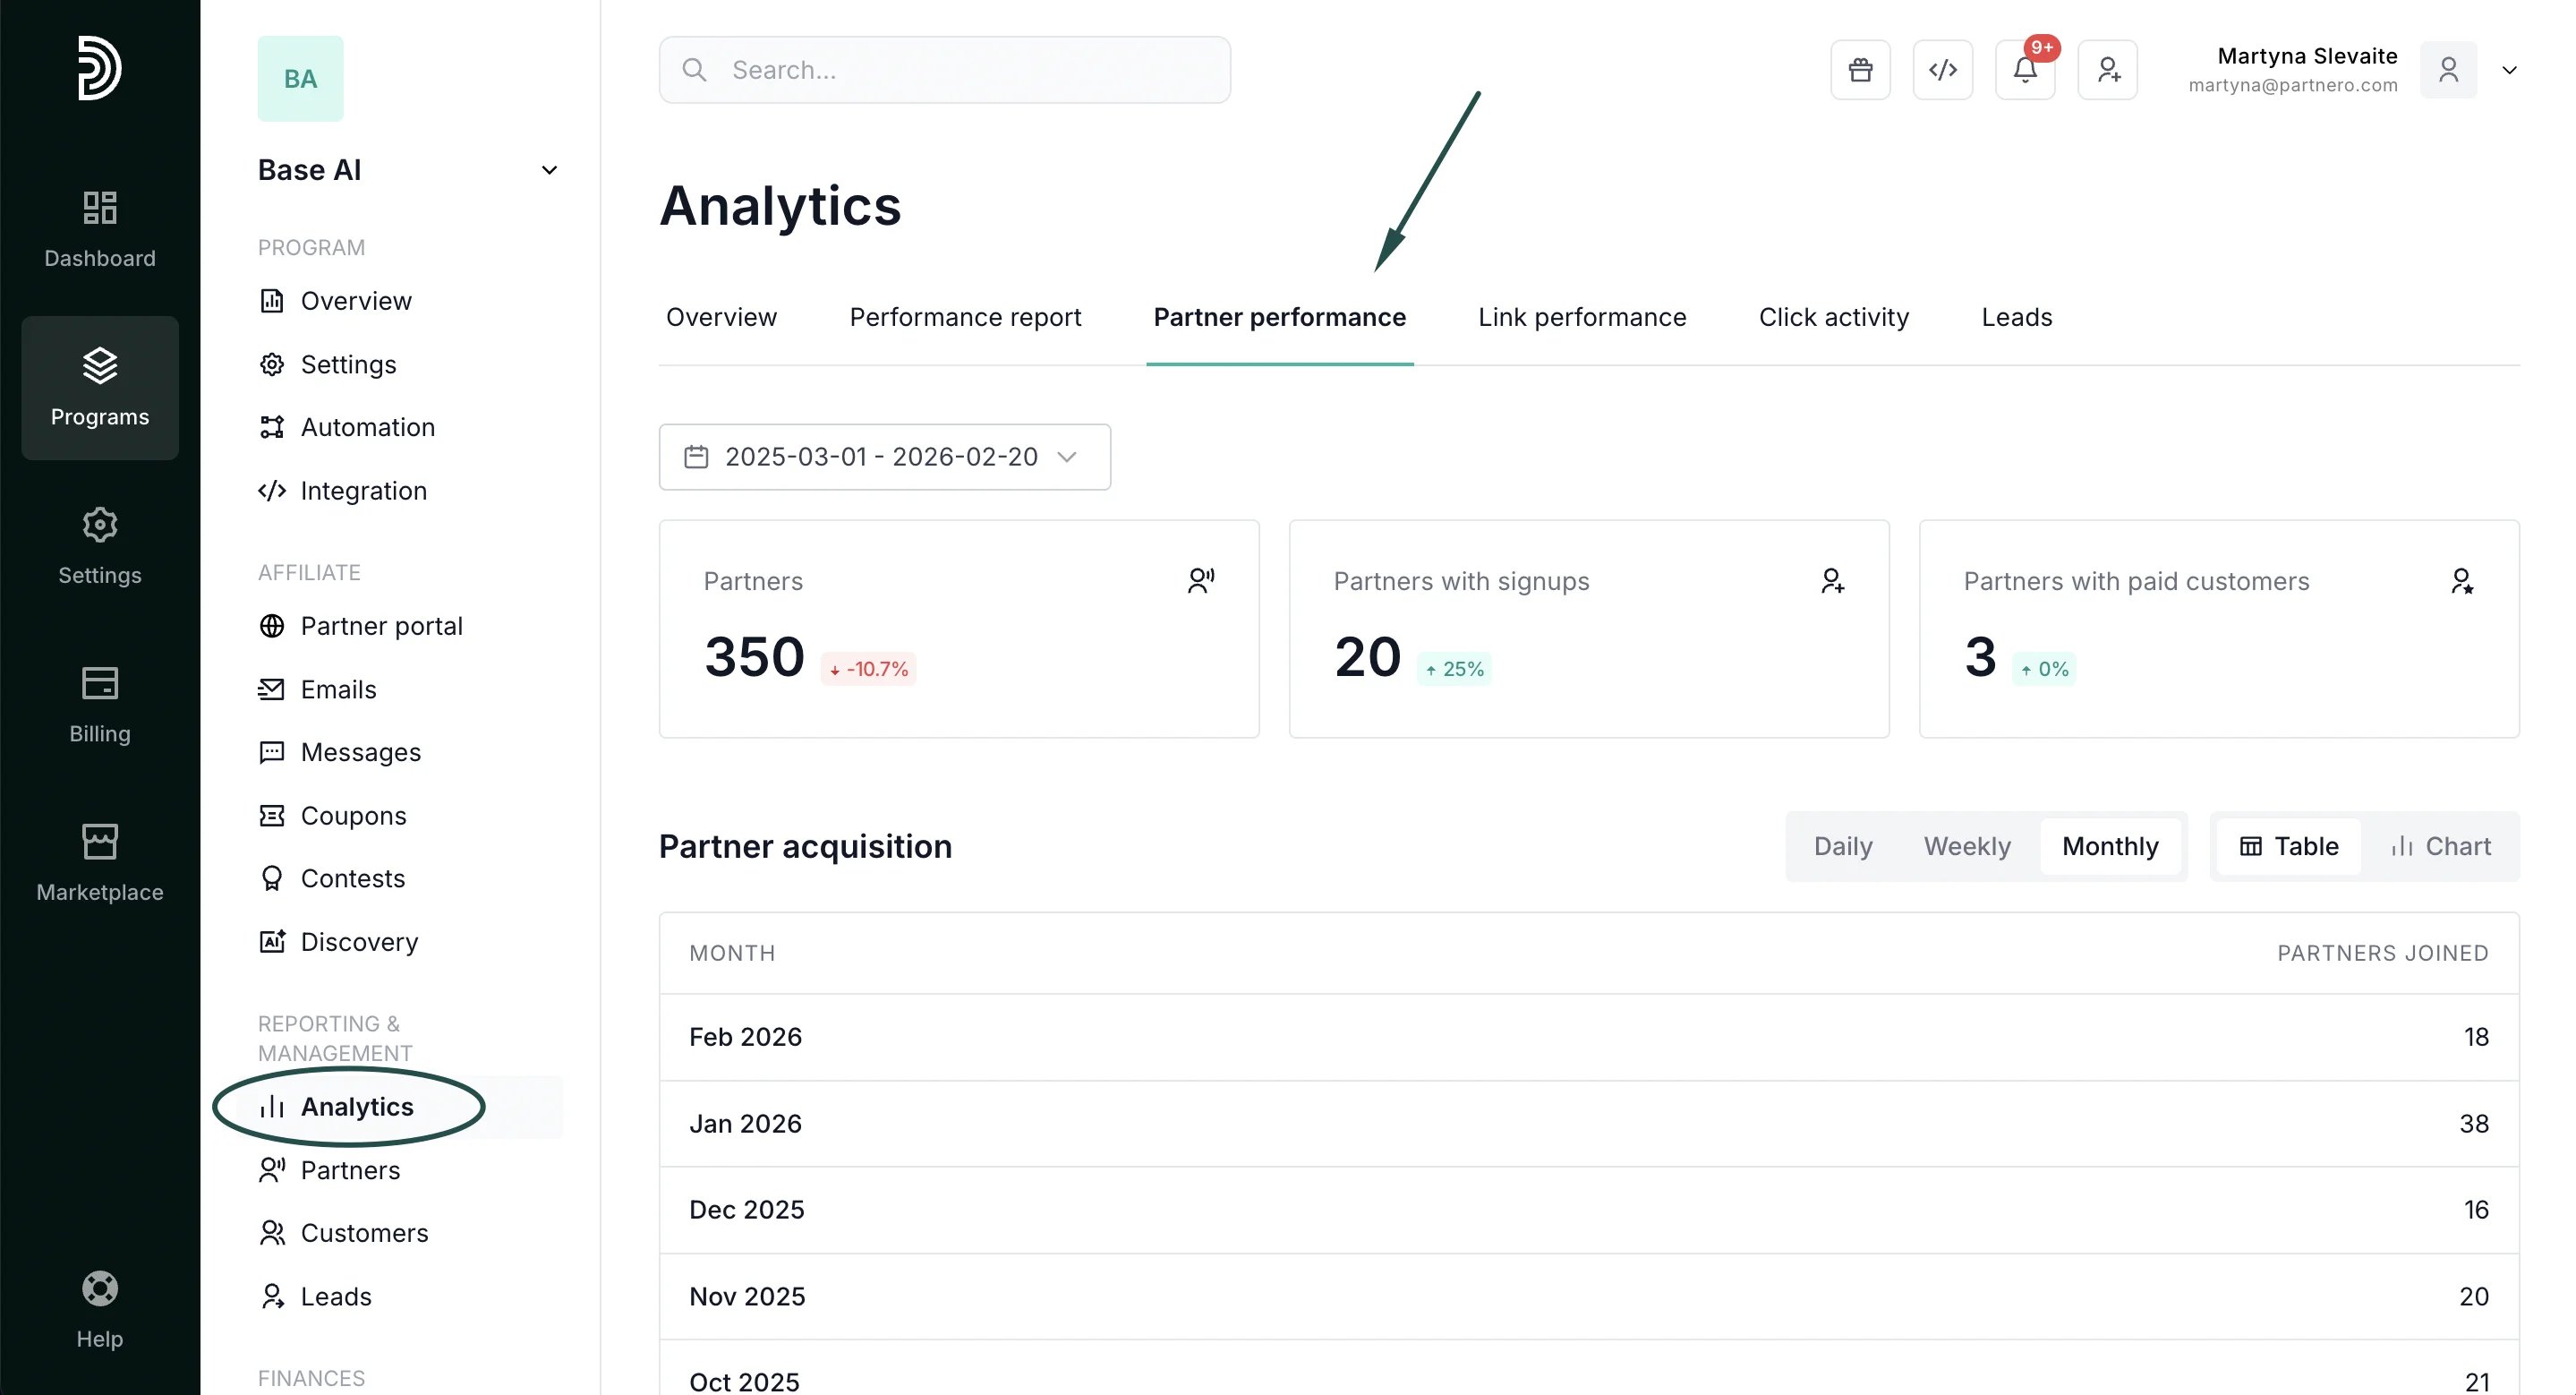 ***
### Partner summary cards
Review performance summary. View all time metrics, select pre-defined periods, or enter a custom time period:
***
### Partner summary cards
Review performance summary. View all time metrics, select pre-defined periods, or enter a custom time period:
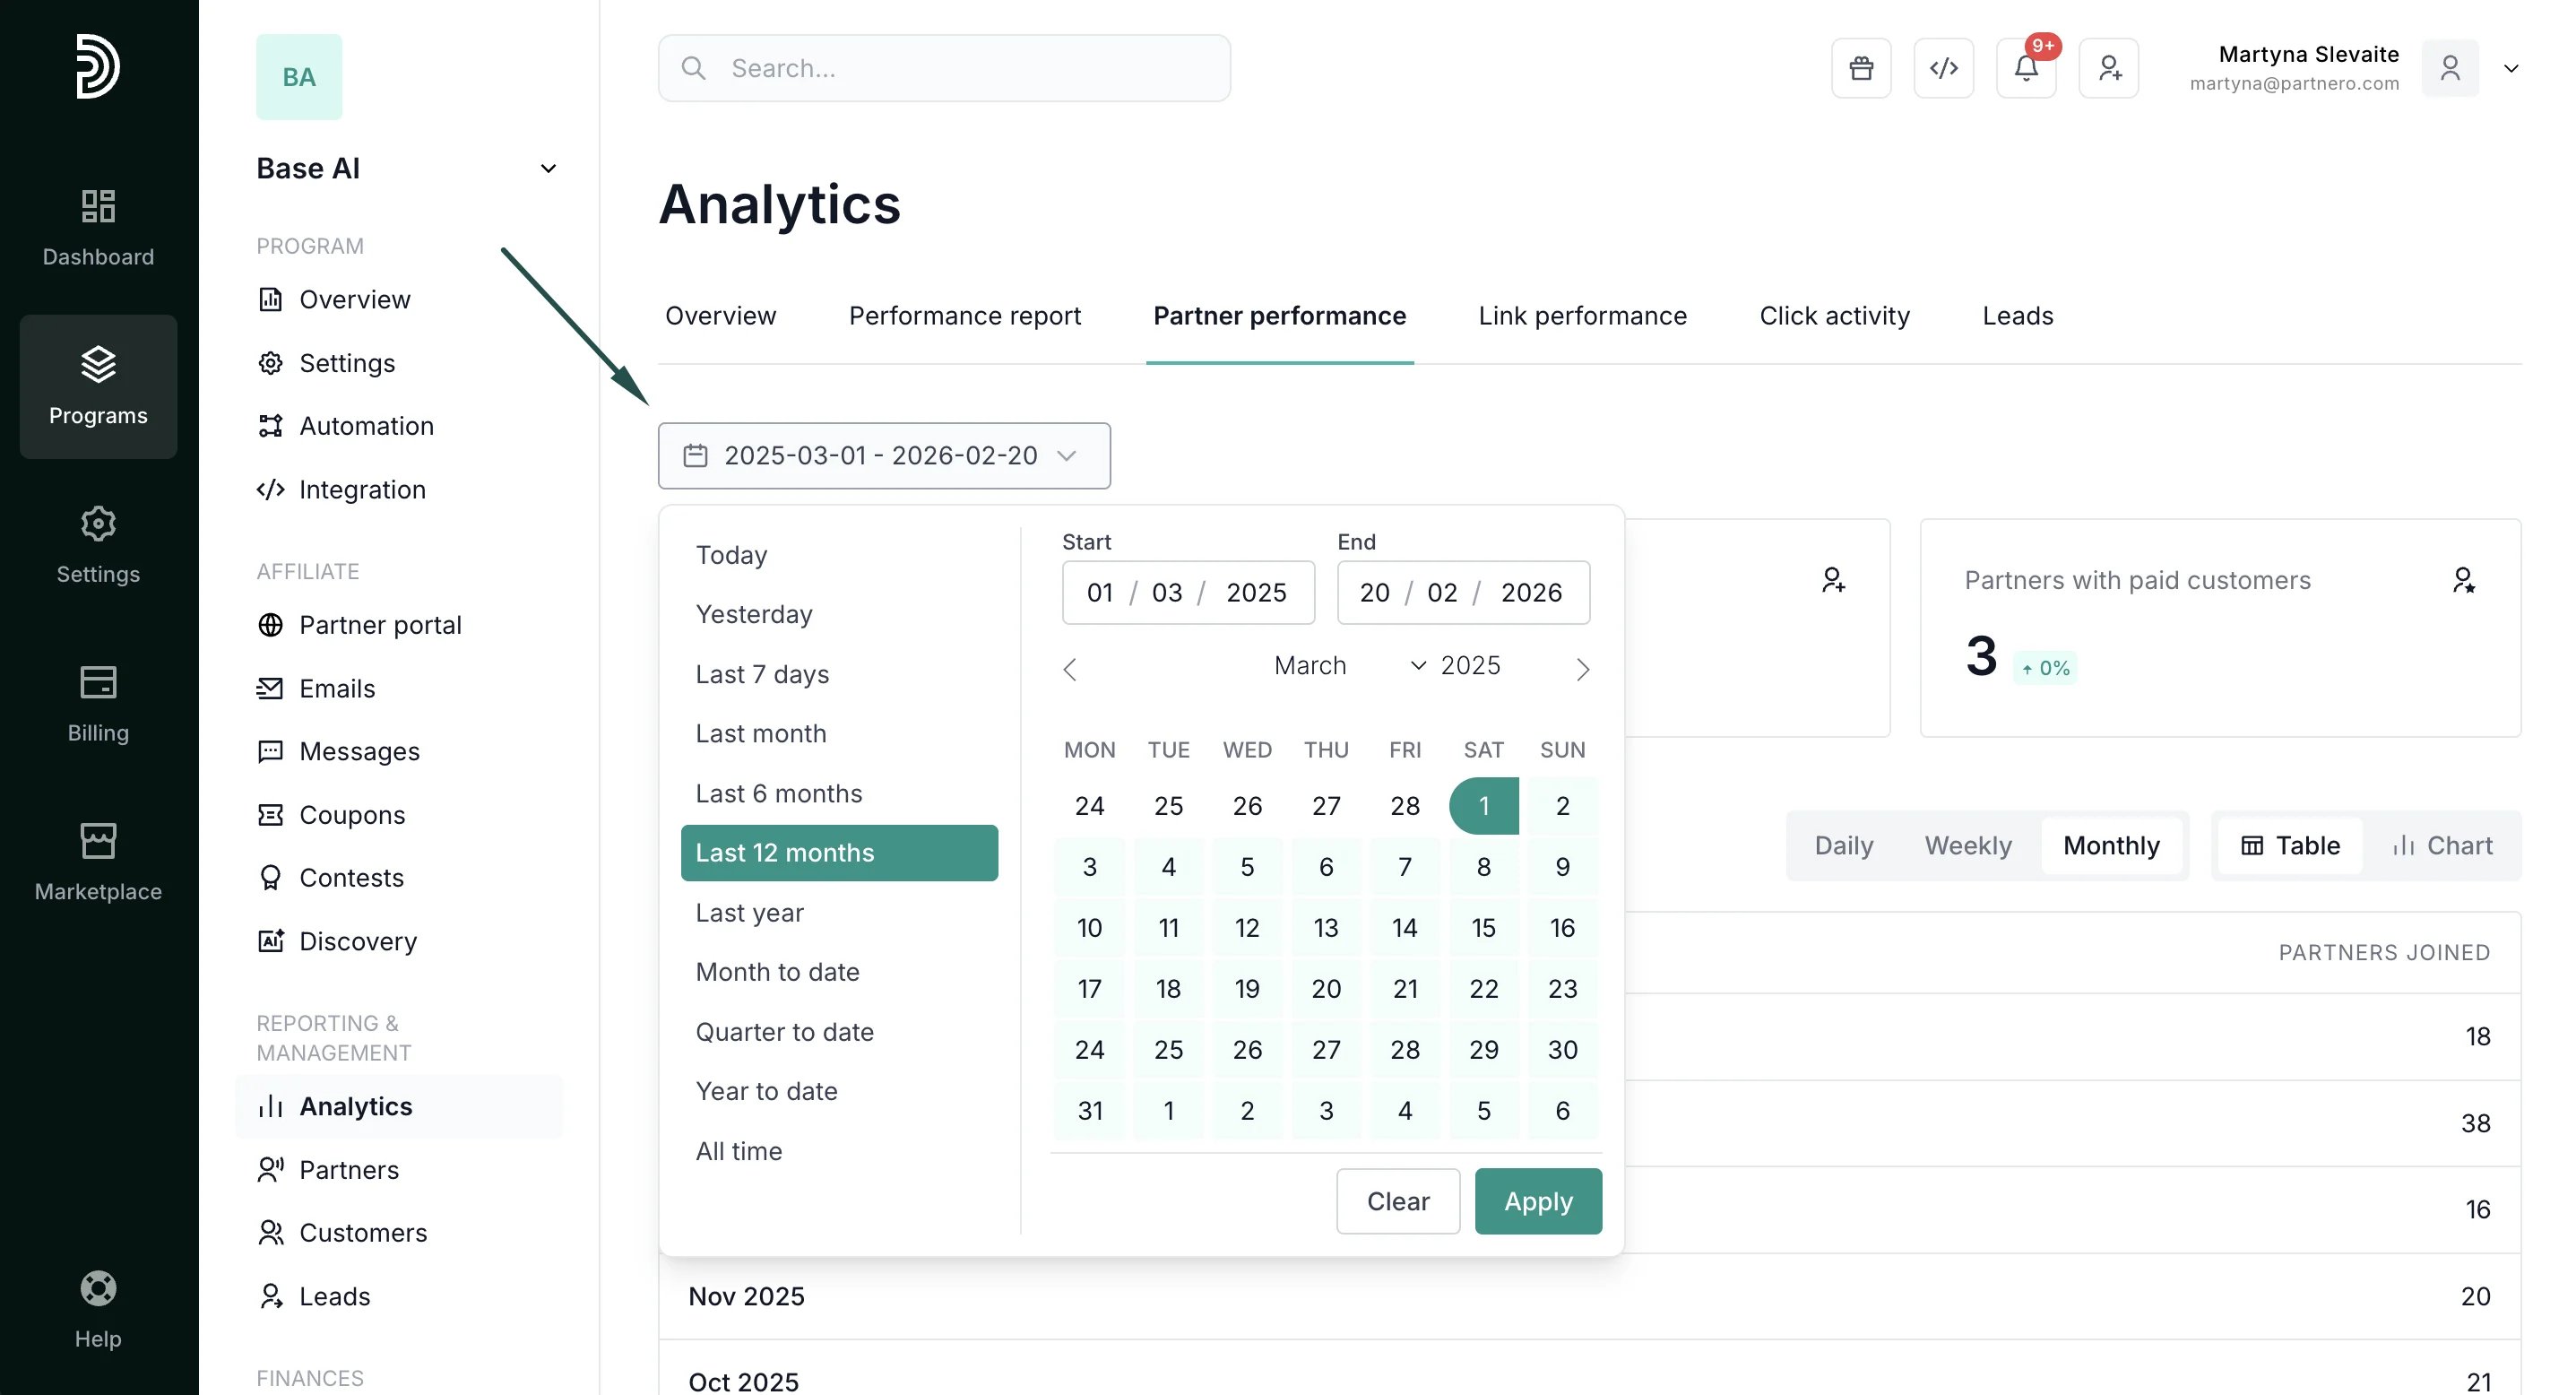 * **Partners**: Your current affiliate network size.
* **Partners with signups**: How many affiliates have referred at least one signup. Click to see the filtered list.
* **Partners with paid customers**: How many affiliates have driven at least one paying customer. Click to see the filtered list.
* **% with signups** and **% with paid customers**: Activation and monetization rates per cohort. If newer cohorts underperform, it signals an onboarding problem.
* **Partners**: Your current affiliate network size.
* **Partners with signups**: How many affiliates have referred at least one signup. Click to see the filtered list.
* **Partners with paid customers**: How many affiliates have driven at least one paying customer. Click to see the filtered list.
* **% with signups** and **% with paid customers**: Activation and monetization rates per cohort. If newer cohorts underperform, it signals an onboarding problem. 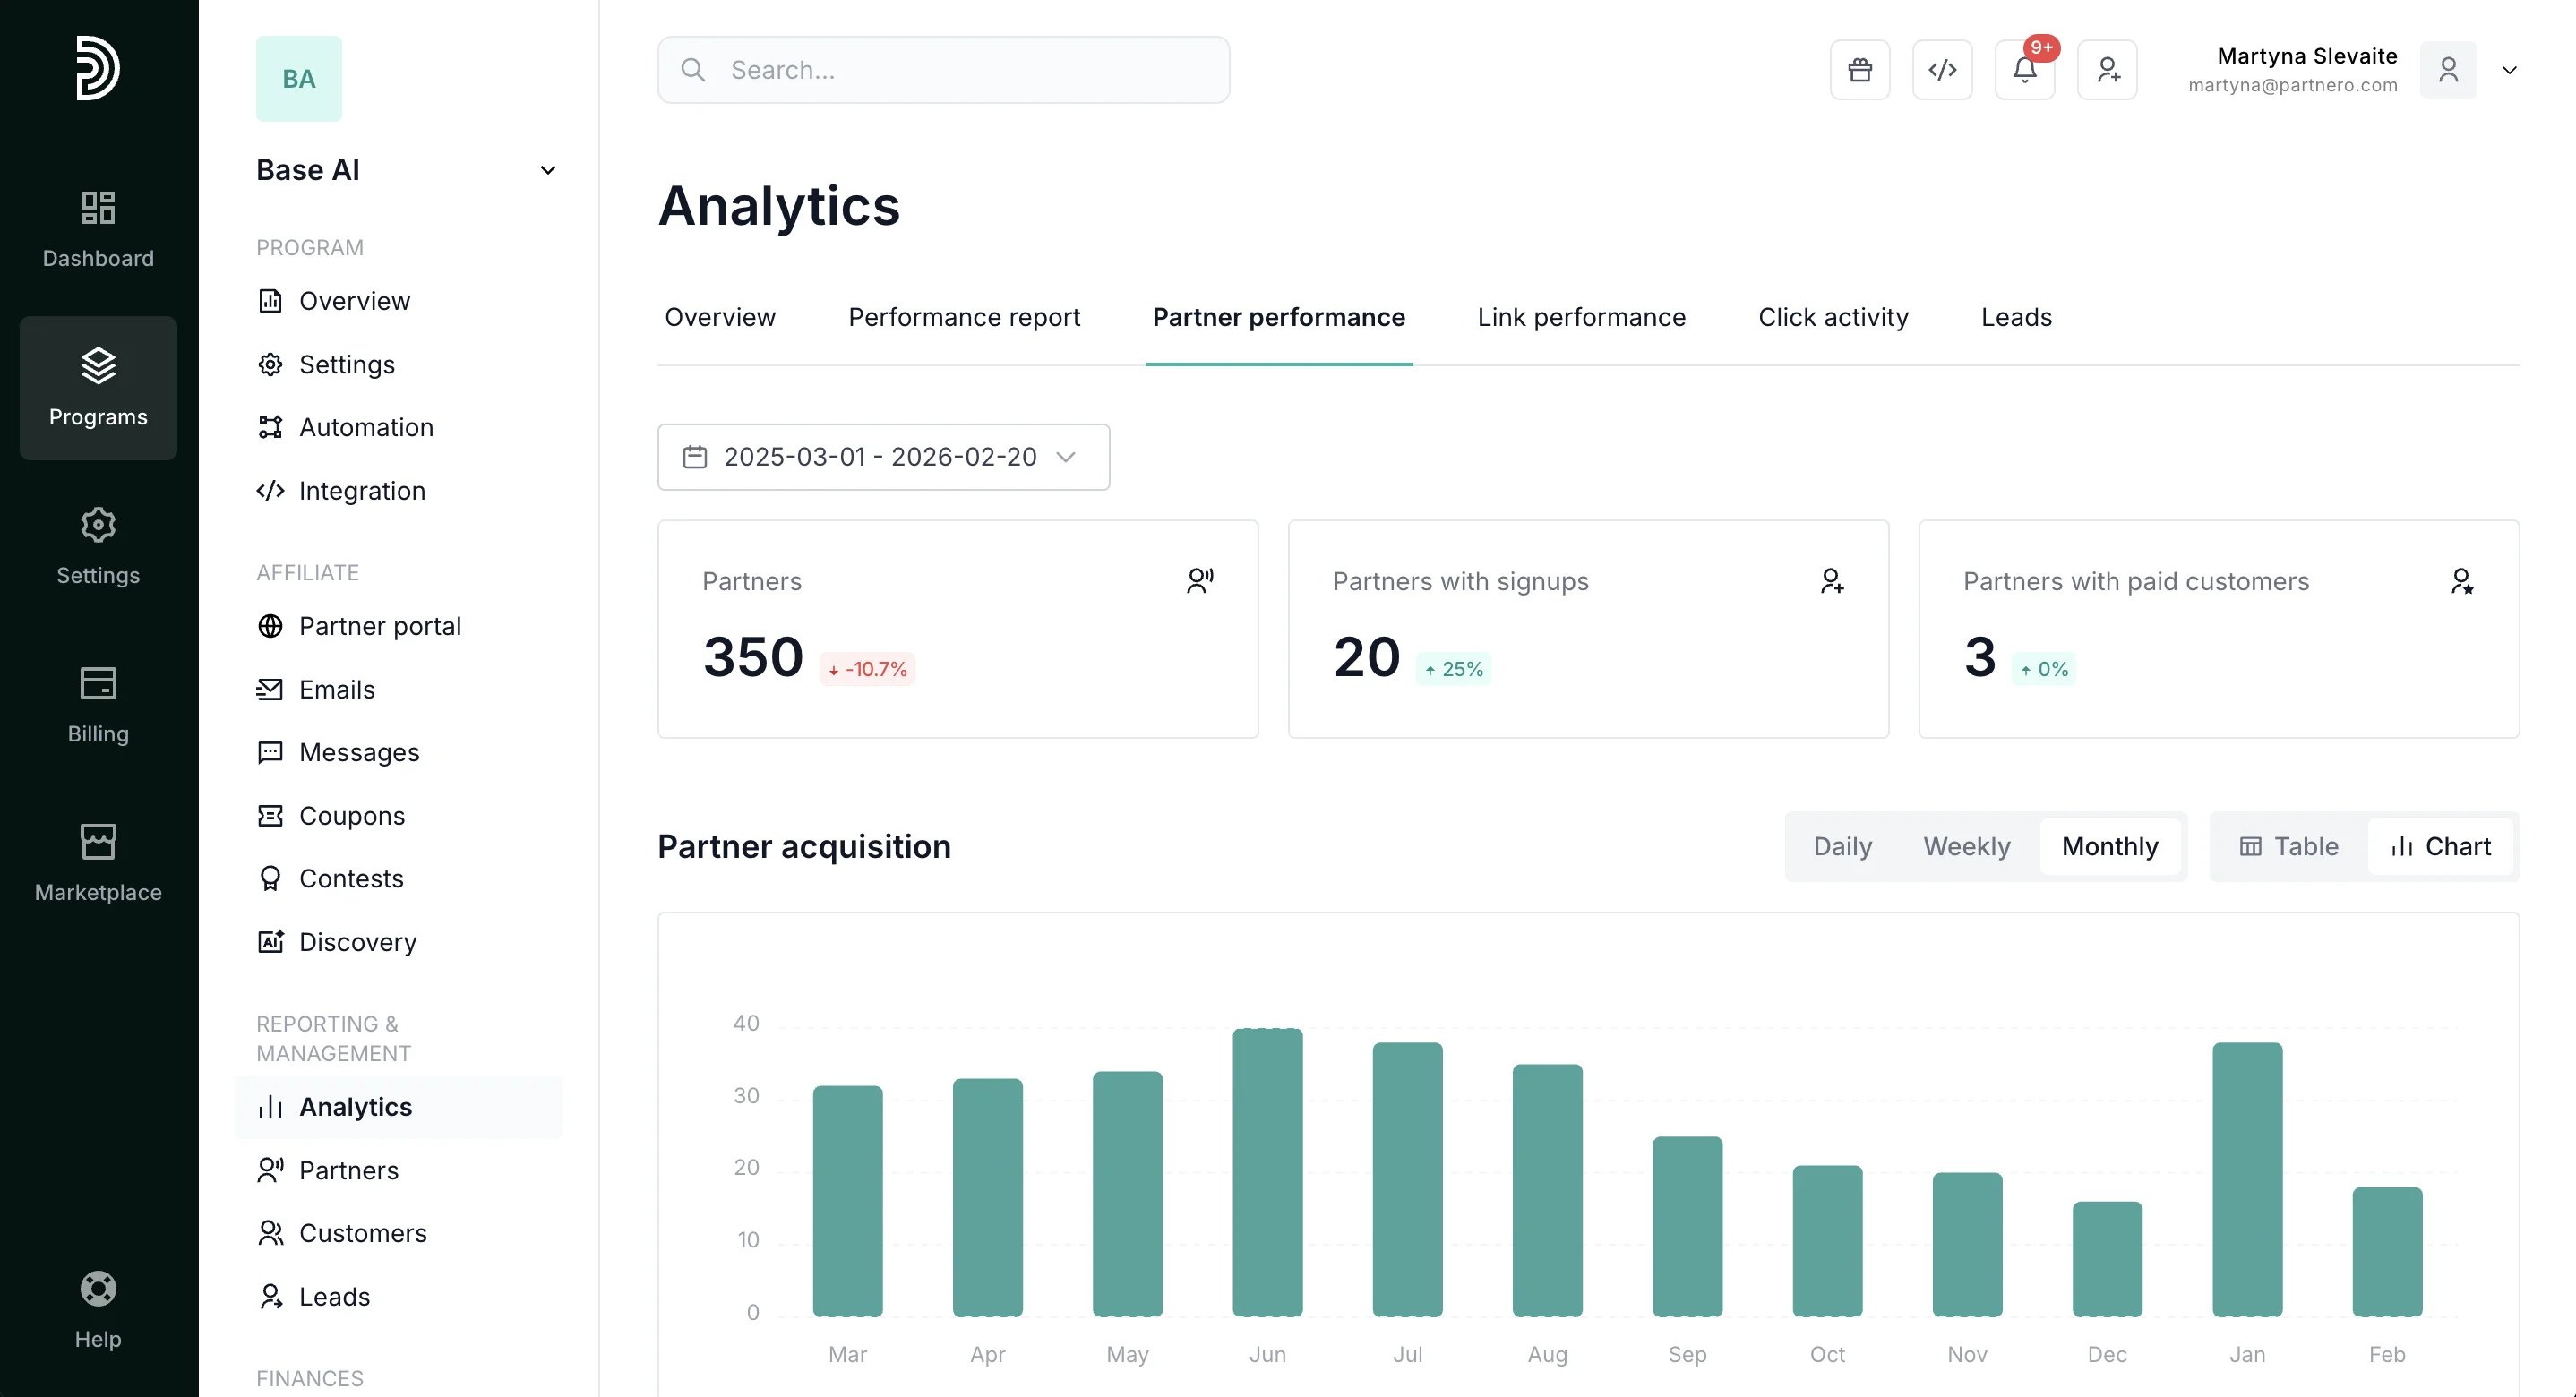 ***
### Partner acquisition
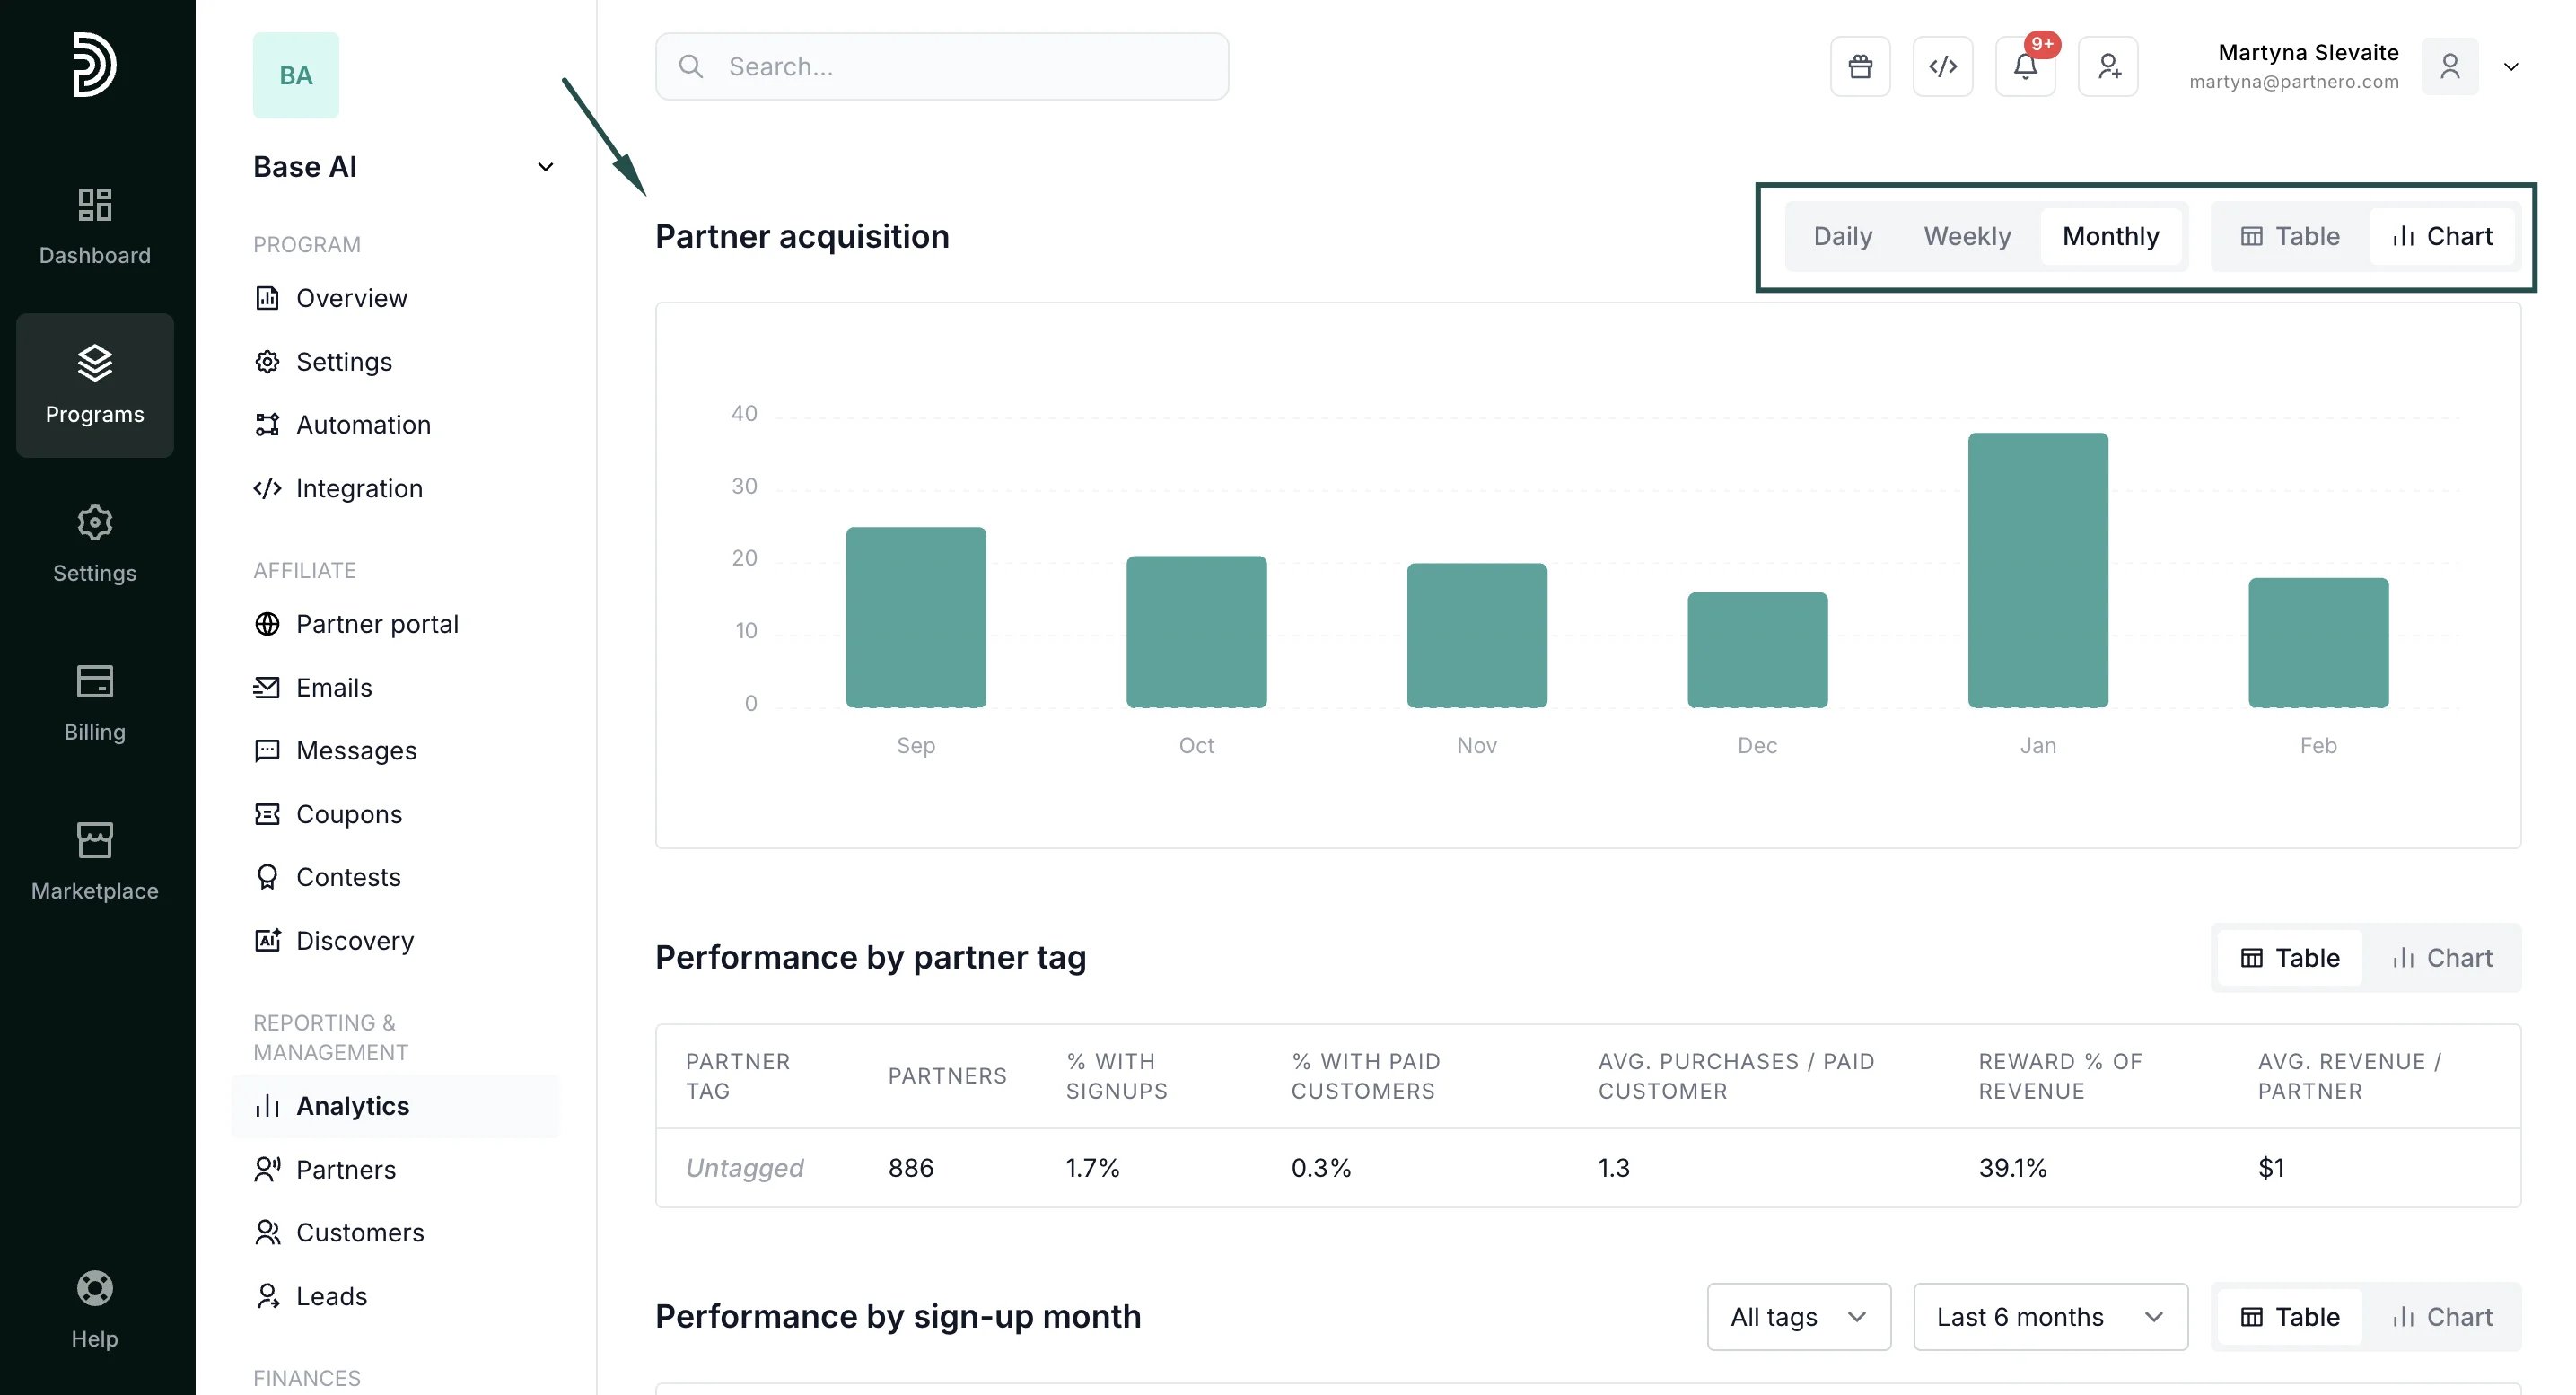
Further down, review your partner acquisition metrics. Switch between daily, weekly, or monthly reports. Also, select table or chart view:
***
### Partner acquisition
Further down, review your partner acquisition metrics. Switch between daily, weekly, or monthly reports. Also, select table or chart view:
 ***
### Cohort analysis: Performance by partner tag and sign-up month
Next, analyze partner performance based on their tag and sign-up month:
***
### Cohort analysis: Performance by partner tag and sign-up month
Next, analyze partner performance based on their tag and sign-up month:
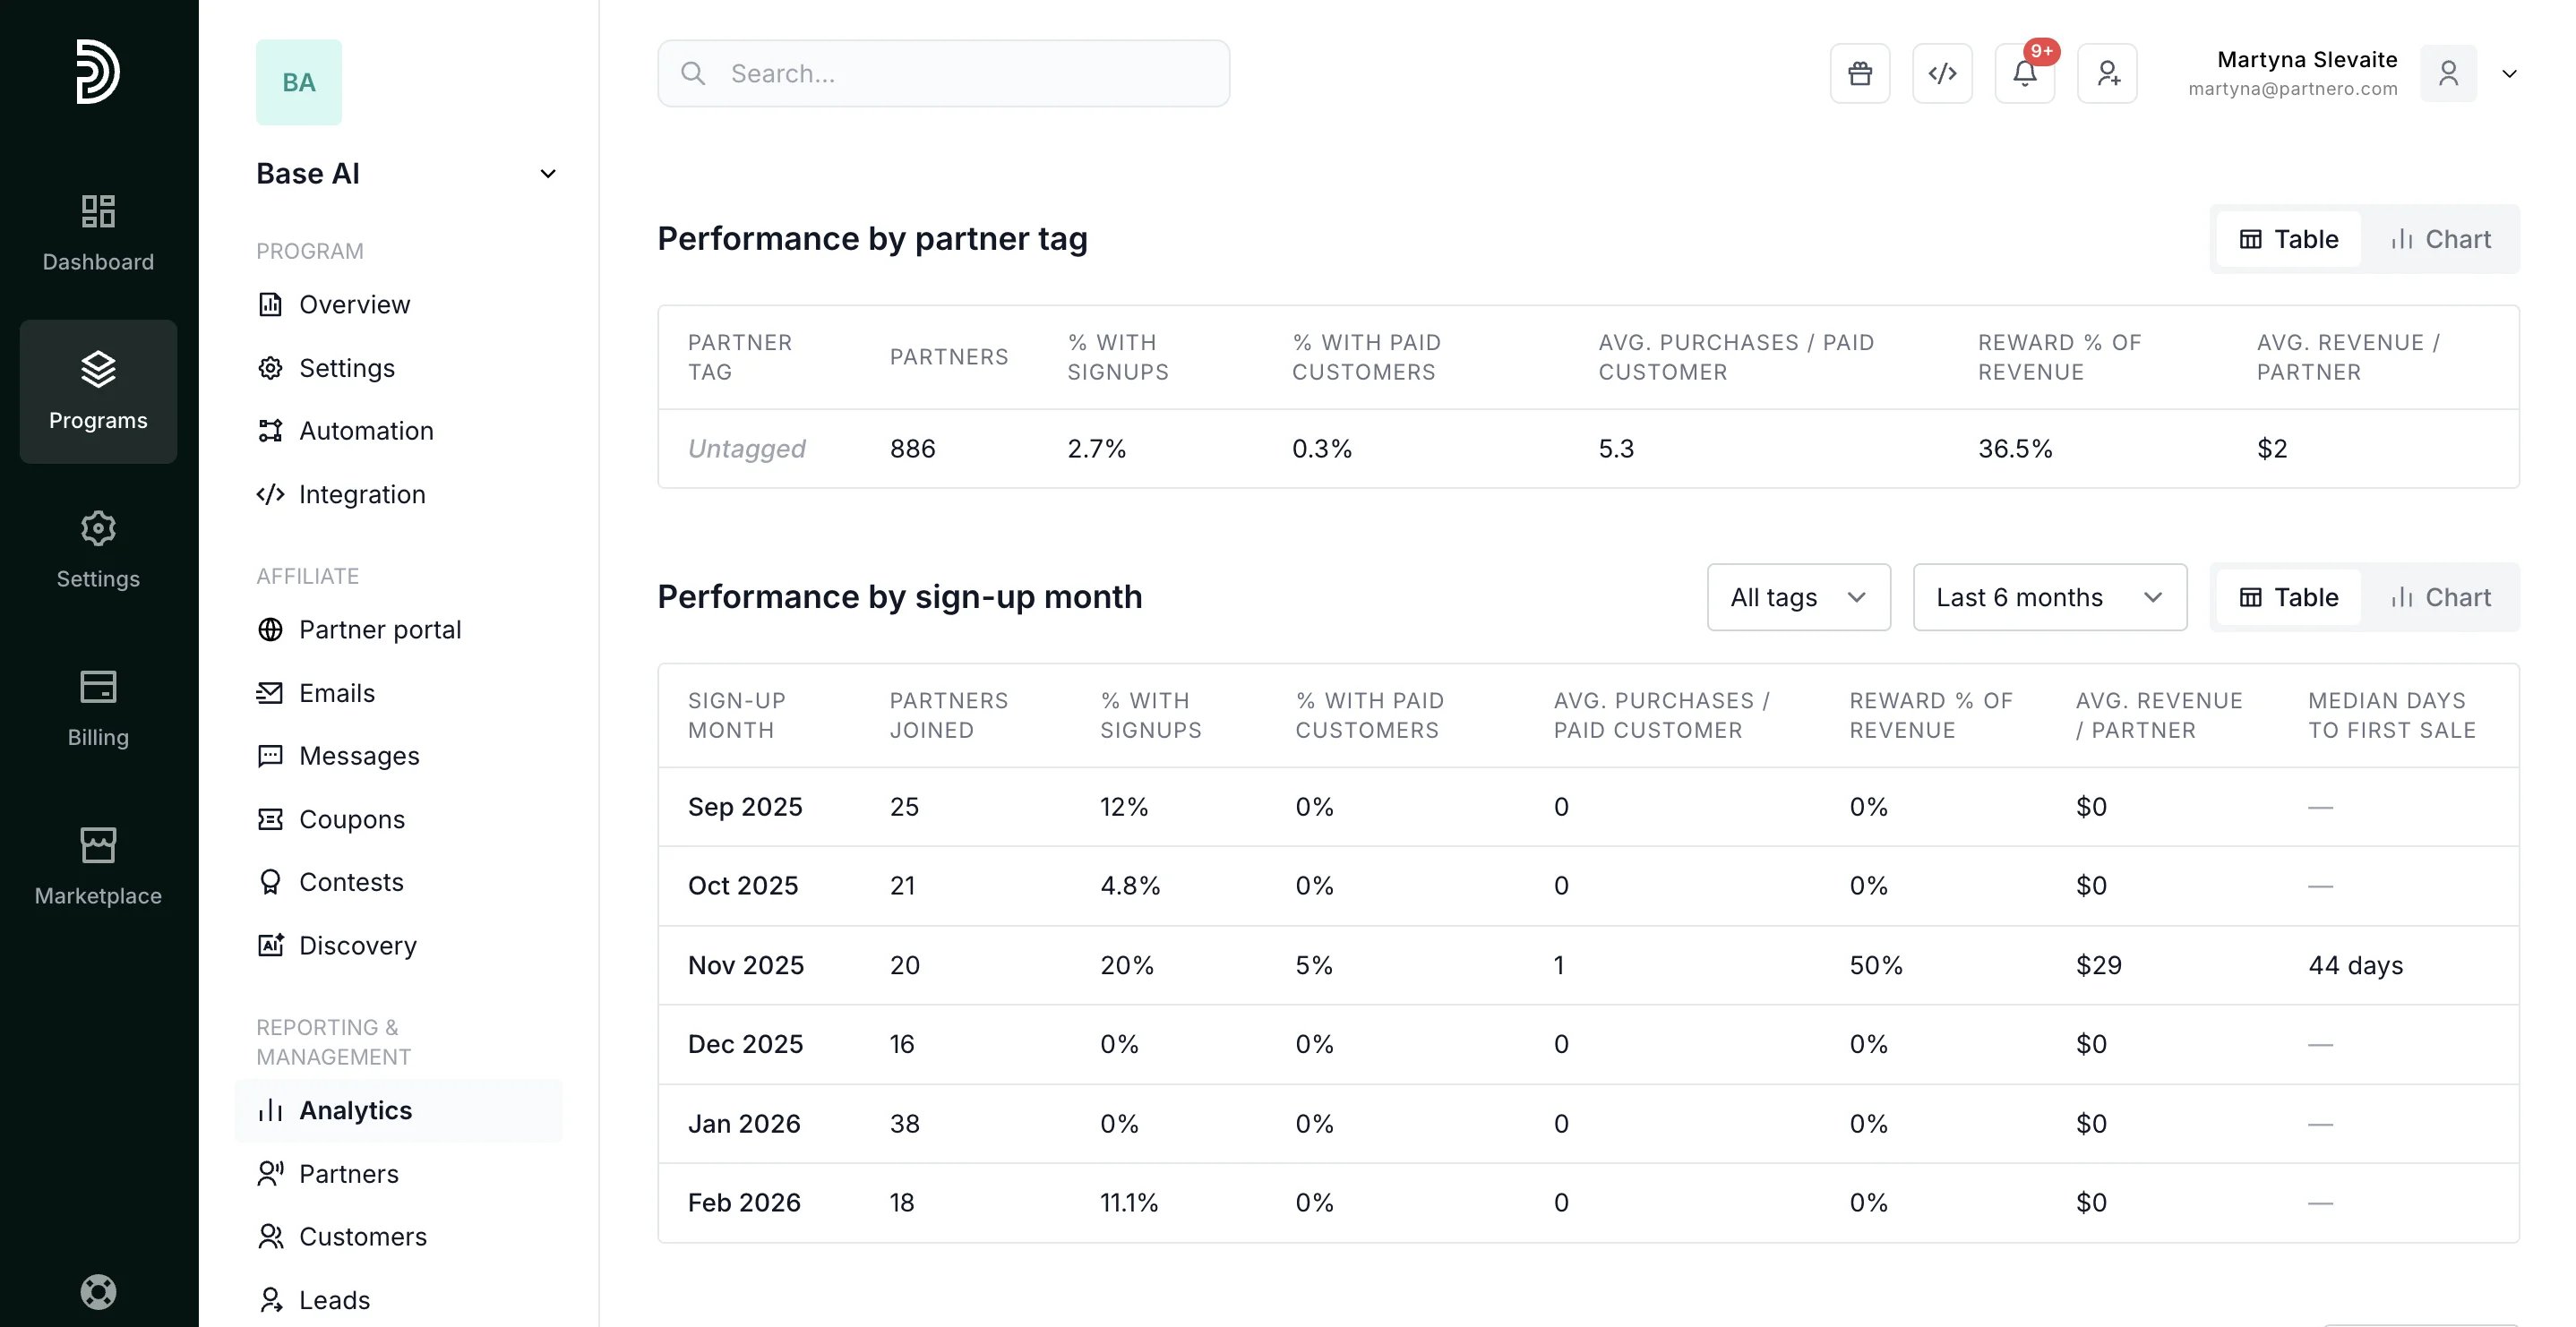 Analyze how each monthly cohort of affiliates performs over time. Identify whether your newer partners are ramping up faster or slower than older ones.
* **Partners joined**: Recruitment volume per month.
* **% with signups** / **% with paid customers**: Activation and monetization rates per cohort. If newer cohorts underperform, it signals an onboarding problem.
* **Avg. purchases per paid customer**: Measures customer lifetime value driven by each partner cohort.
* **Reward % of revenue**: What share of affiliate-generated revenue goes back as commissions. Tracks commission sustainability.
* **Avg. revenue per partner**: The single best metric for affiliate ROI. Compare across monthly cohorts to see if partner quality is improving.
* **Median days to first sale**: How long new affiliates take to generate their first transaction. A leading indicator of partner activation and program stickiness.
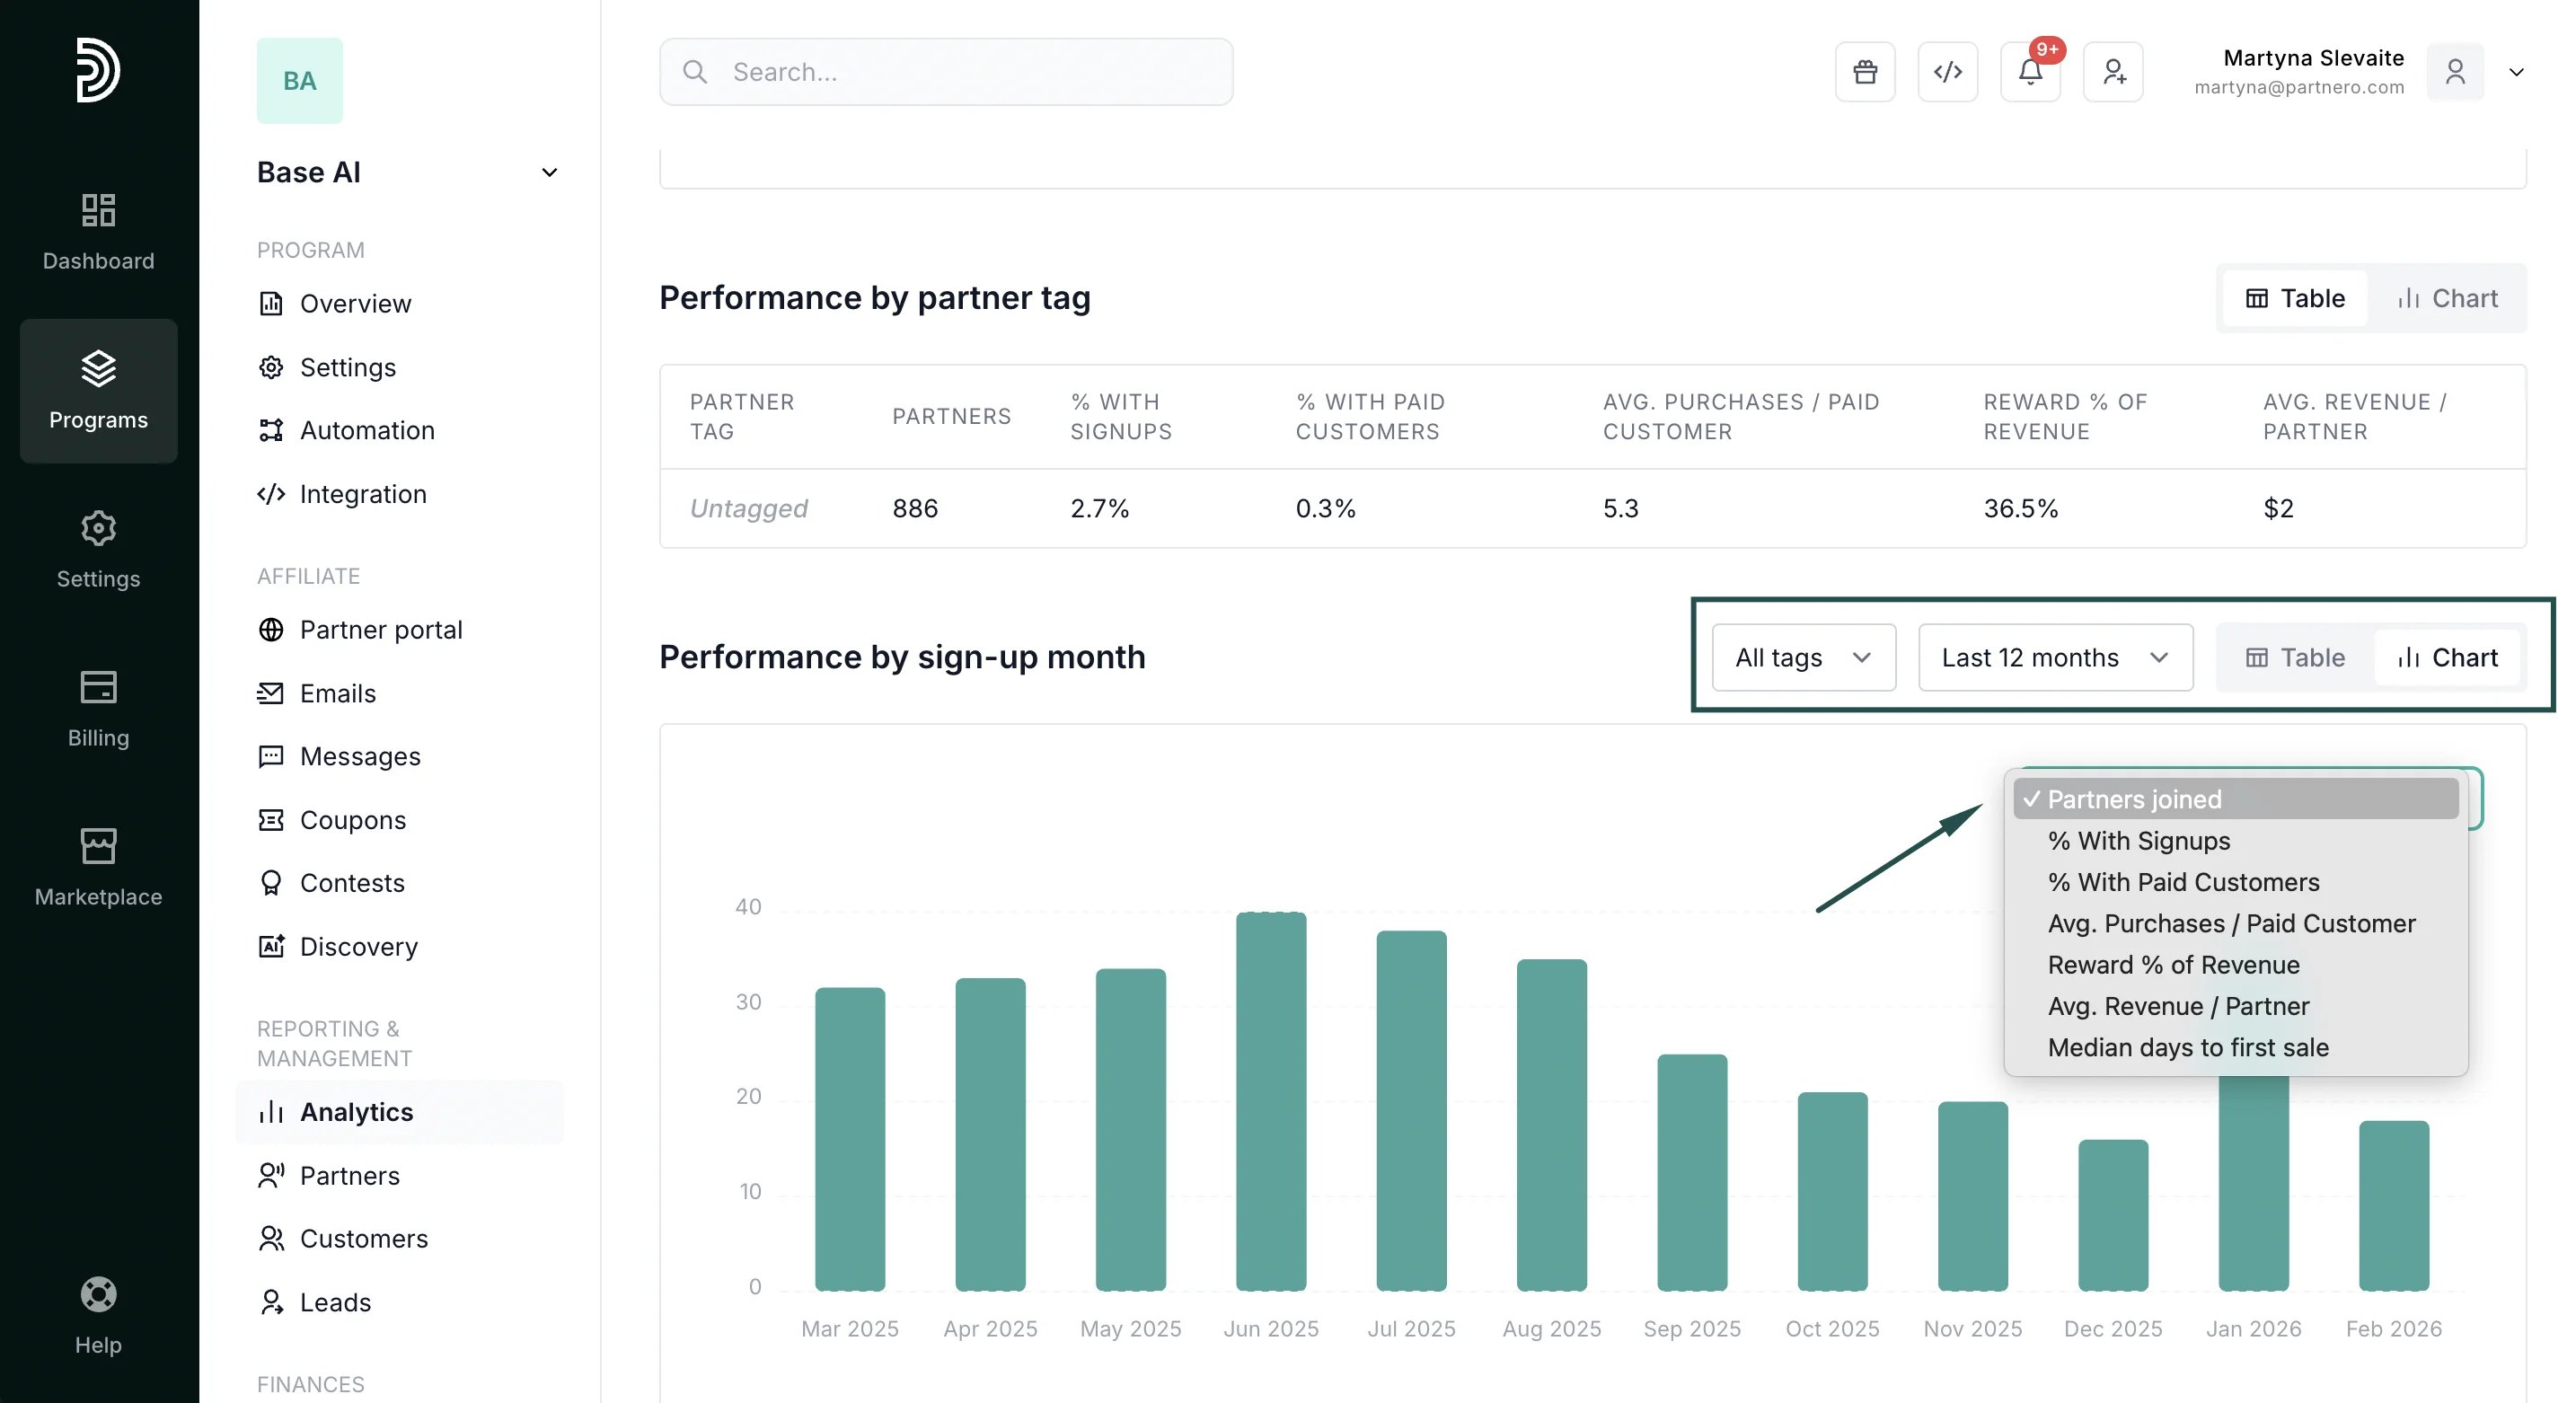
Slice the same metrics by custom partner tags (e.g., "premium", "influencer", "content-creator") to compare performance across partner segments.
Select a time period, and switch between table and chart views. In the table view, select which metric you wish to see:
Analyze how each monthly cohort of affiliates performs over time. Identify whether your newer partners are ramping up faster or slower than older ones.
* **Partners joined**: Recruitment volume per month.
* **% with signups** / **% with paid customers**: Activation and monetization rates per cohort. If newer cohorts underperform, it signals an onboarding problem.
* **Avg. purchases per paid customer**: Measures customer lifetime value driven by each partner cohort.
* **Reward % of revenue**: What share of affiliate-generated revenue goes back as commissions. Tracks commission sustainability.
* **Avg. revenue per partner**: The single best metric for affiliate ROI. Compare across monthly cohorts to see if partner quality is improving.
* **Median days to first sale**: How long new affiliates take to generate their first transaction. A leading indicator of partner activation and program stickiness.
Slice the same metrics by custom partner tags (e.g., "premium", "influencer", "content-creator") to compare performance across partner segments.
Select a time period, and switch between table and chart views. In the table view, select which metric you wish to see:
 Use these insights to refine your affiliate recruitment strategy and focus on the segments that deliver the highest ROI.
**Partner acquisition trend**: Visualize how your affiliate network grows over time. Group by day, month, or year to spot seasonal patterns or the impact of specific recruitment efforts.
**Top partners table**: Lastly, you'll findour highest-performing affiliates ranked by signups, sales, revenue, and rewards. Click through to any partner's profile for a deep dive.
Use these insights to refine your affiliate recruitment strategy and focus on the segments that deliver the highest ROI.
**Partner acquisition trend**: Visualize how your affiliate network grows over time. Group by day, month, or year to spot seasonal patterns or the impact of specific recruitment efforts.
**Top partners table**: Lastly, you'll findour highest-performing affiliates ranked by signups, sales, revenue, and rewards. Click through to any partner's profile for a deep dive. 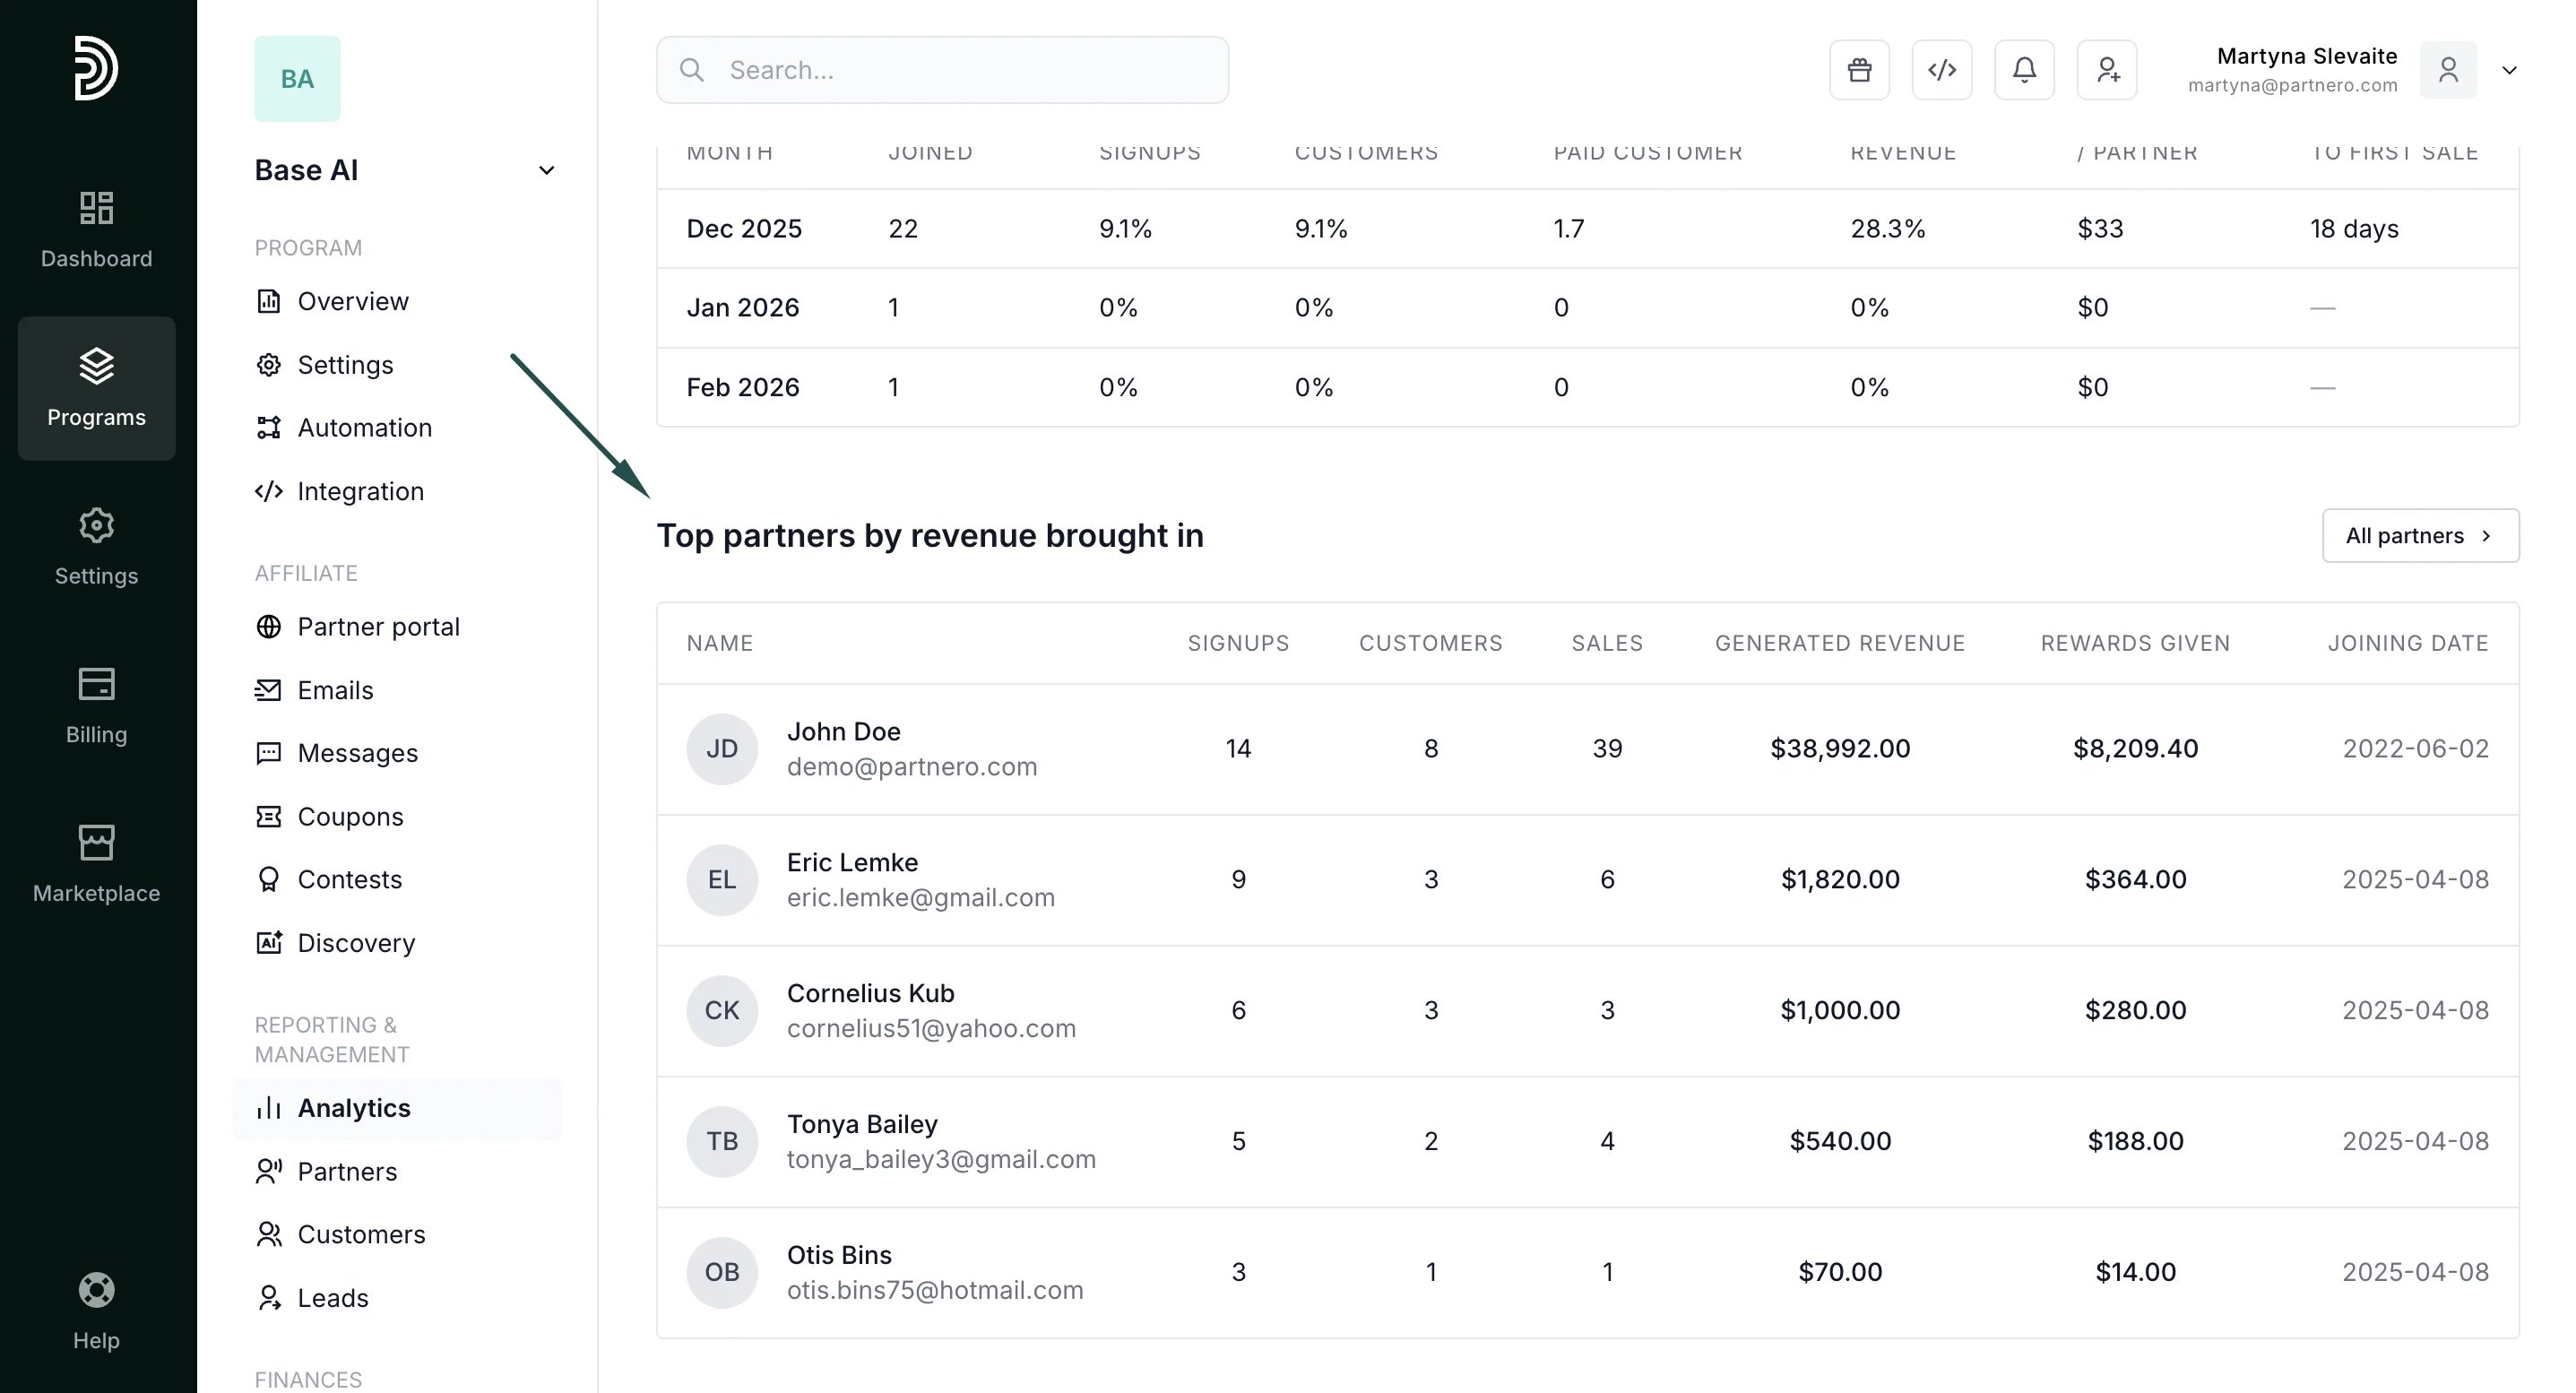 ***
#### Continue reading about analytics
Explore other analytics reports to better understand your performance and optimize your partner program:
* [Analytics Overview](/knowledge-base/analytics-reporting/analytics-overview) – High-level dashboard summary of your program’s performance
* [Performance Report](/knowledge-base/analytics-reporting/performance-report) – Detailed breakdown of conversions, revenue, and partner results
* [Link Performance](/knowledge-base/analytics-reporting/link-performance) – Analyze how individual tracking links are performing
* [Click Activity](/knowledge-base/analytics-reporting/click-activity) – Review detailed click-level data and traffic insights
* [Lead Analytics](/knowledge-base/analytics-reporting/lead-analytics-overview) – Monitor lead acquisition trends and quality
This documentation is built and hosted on [Mintlify](https://mintlify.com), a developer documentation platform.
***
#### Continue reading about analytics
Explore other analytics reports to better understand your performance and optimize your partner program:
* [Analytics Overview](/knowledge-base/analytics-reporting/analytics-overview) – High-level dashboard summary of your program’s performance
* [Performance Report](/knowledge-base/analytics-reporting/performance-report) – Detailed breakdown of conversions, revenue, and partner results
* [Link Performance](/knowledge-base/analytics-reporting/link-performance) – Analyze how individual tracking links are performing
* [Click Activity](/knowledge-base/analytics-reporting/click-activity) – Review detailed click-level data and traffic insights
* [Lead Analytics](/knowledge-base/analytics-reporting/lead-analytics-overview) – Monitor lead acquisition trends and quality
This documentation is built and hosted on [Mintlify](https://mintlify.com), a developer documentation platform.