> ## Documentation Index
> Fetch the complete documentation index at: https://docs.partnero.com/llms.txt
> Use this file to discover all available pages before exploring further.
# Analytics: Performance report
The **Performance report** (formerly Daily Report) is your primary tool for analyzing affiliate program trends. Choose any date range, group data by day, week, or month, and compare performance across periods.
To access, open your program, click on **Analytics,** and switch to the **Performance report** tab: 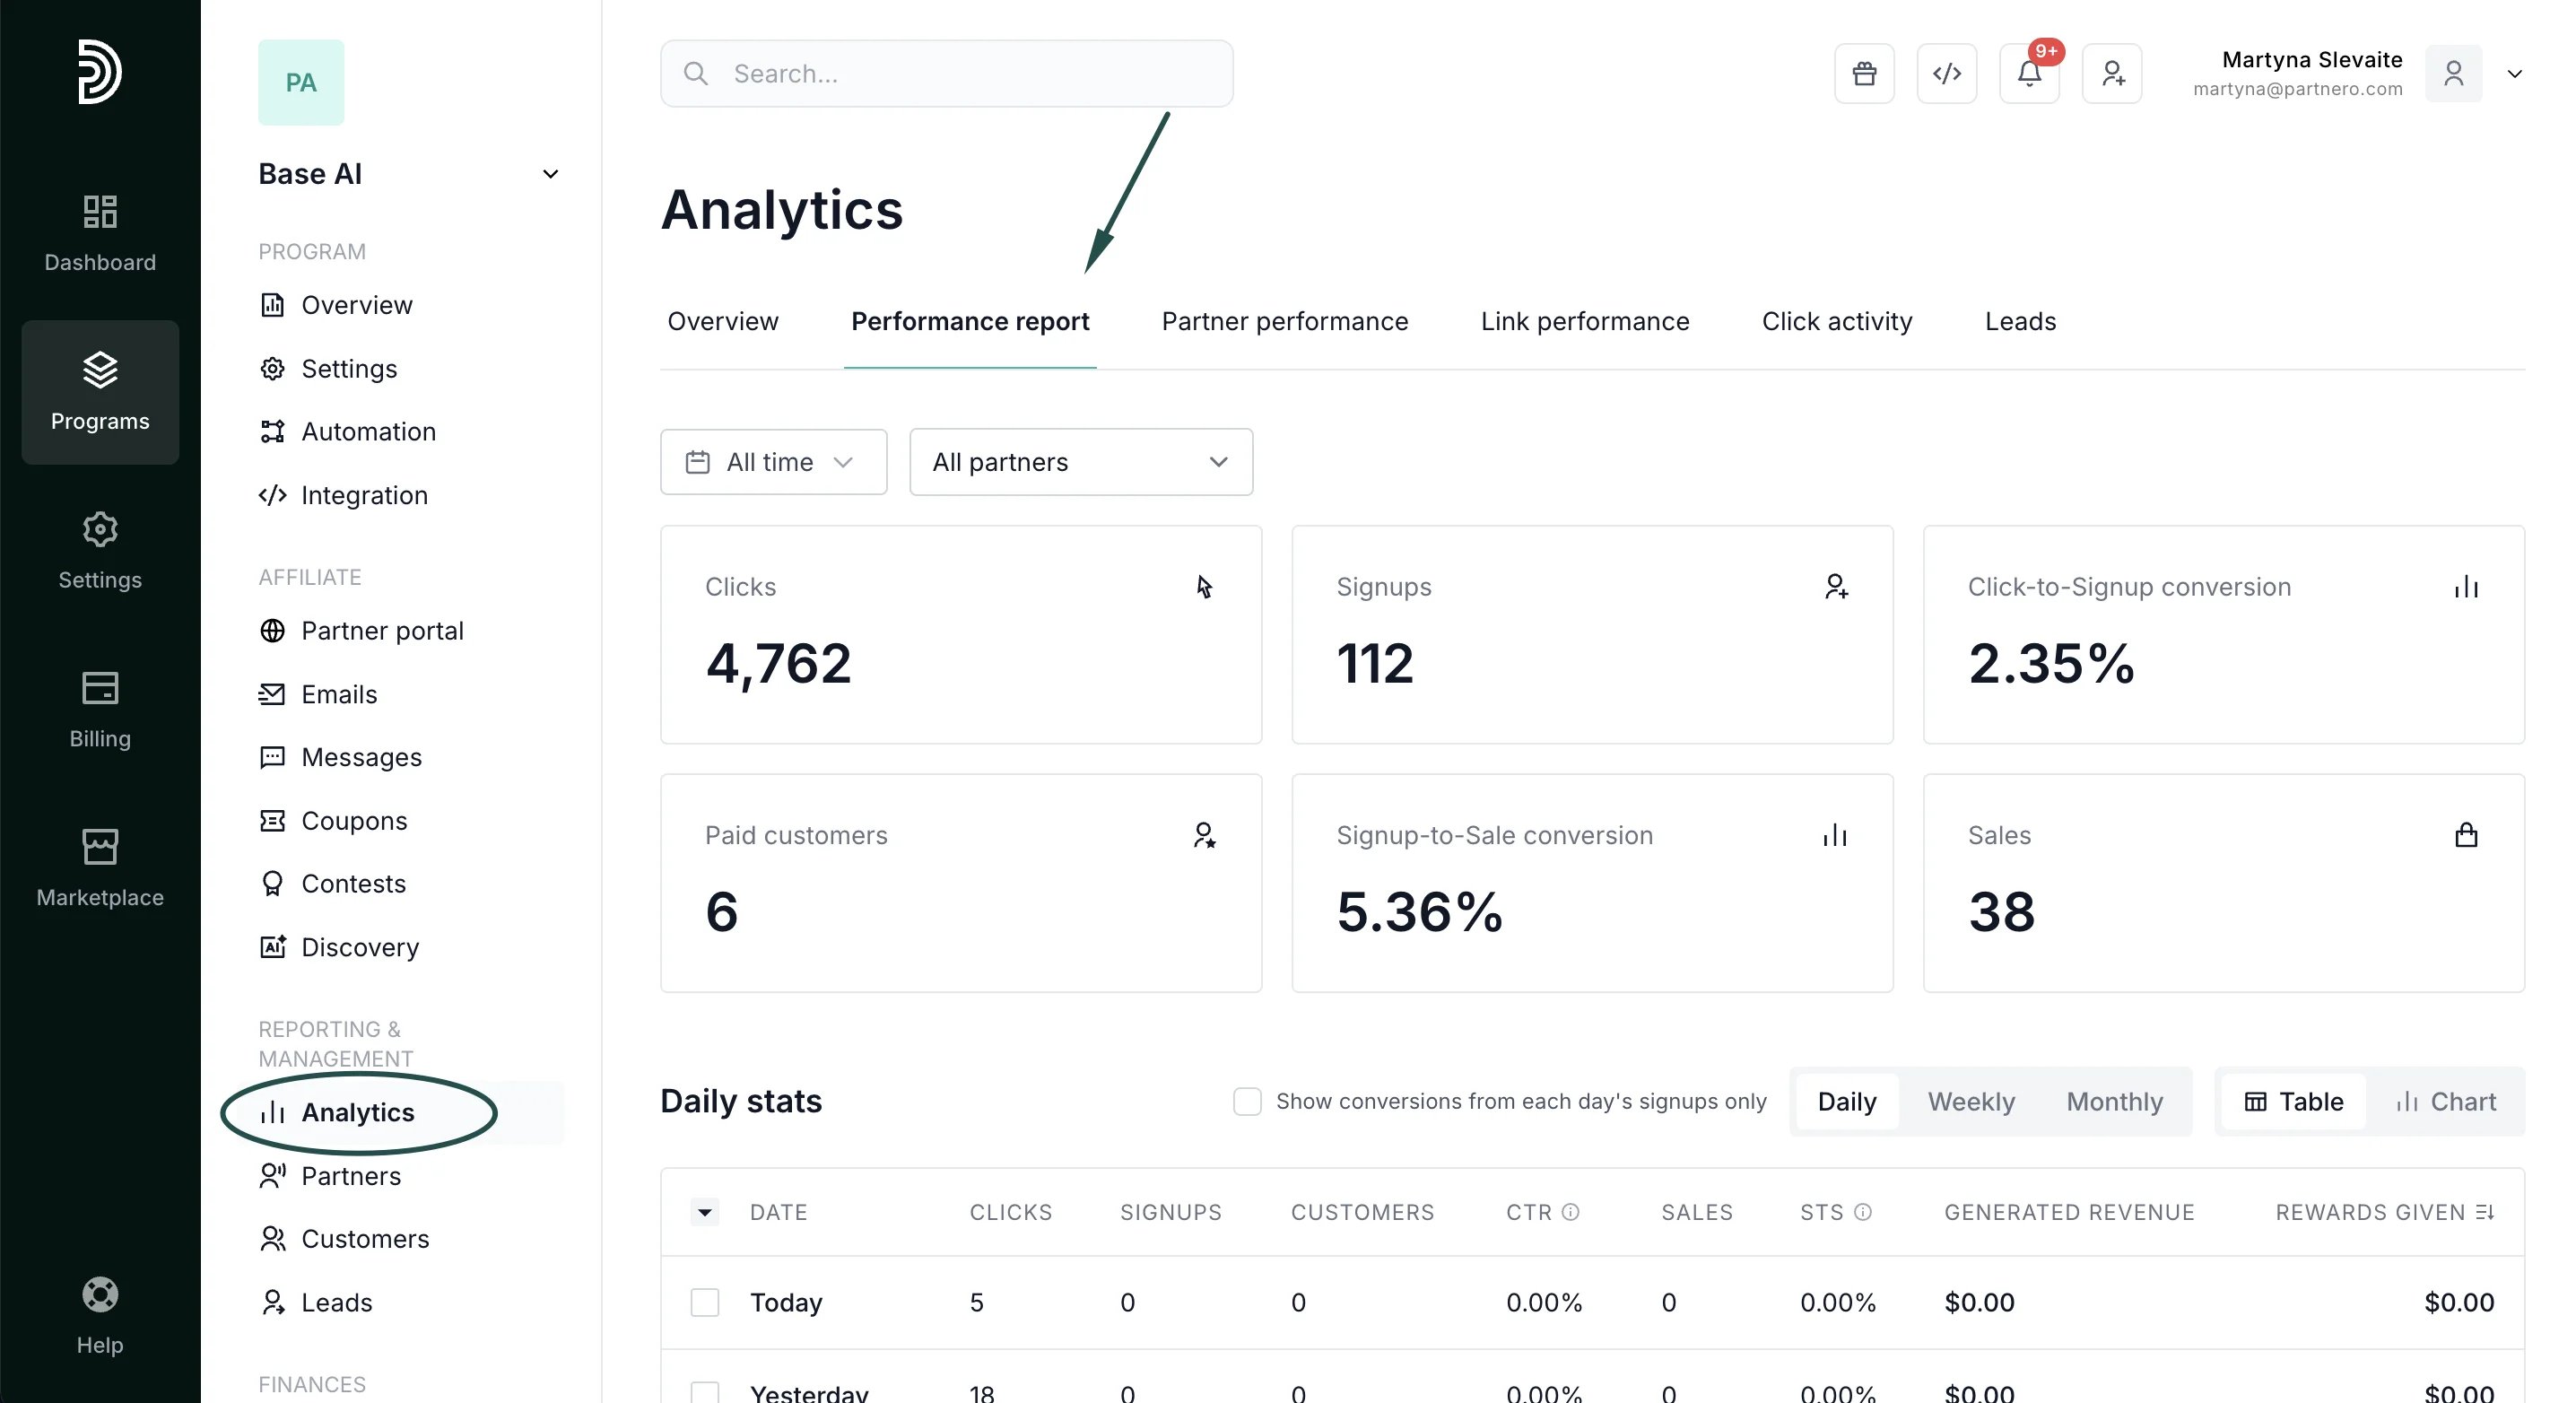 ***
### Summary metrics
Review performance summary. View all time metrics, select pre-defined periods, or enter a custom time period:
***
### Summary metrics
Review performance summary. View all time metrics, select pre-defined periods, or enter a custom time period: 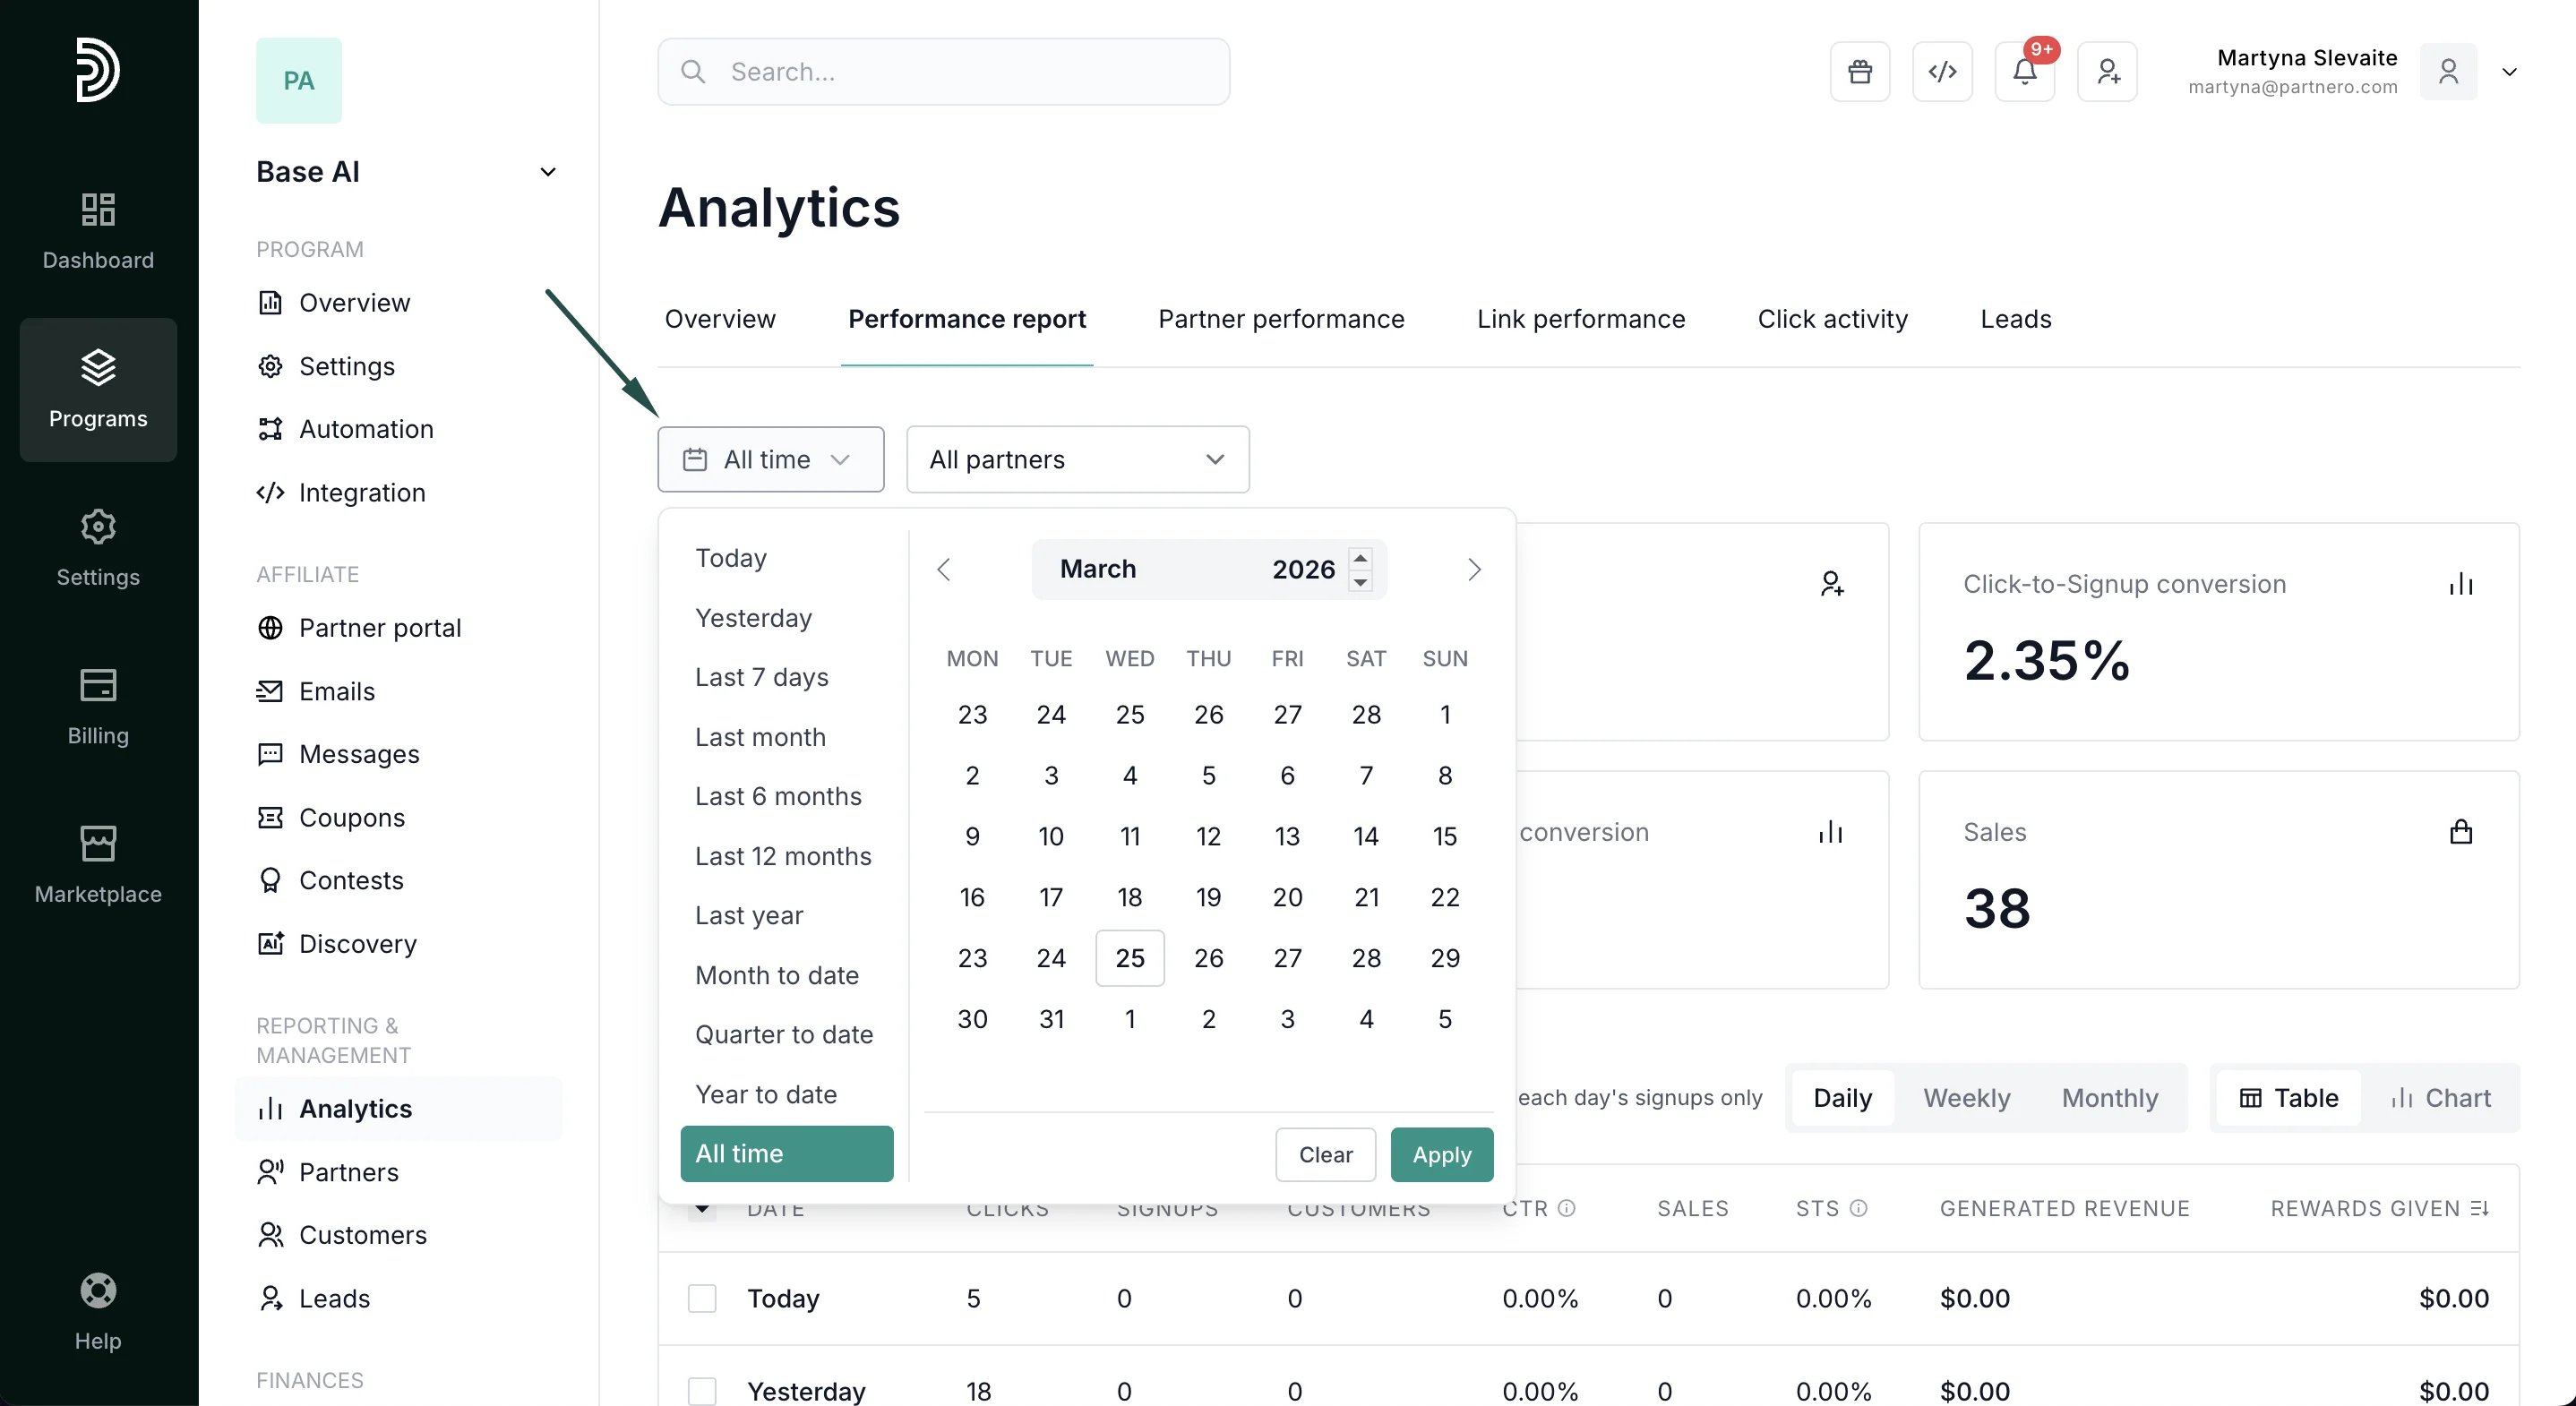 Additionally, filter metrics based on **partner tags**:
 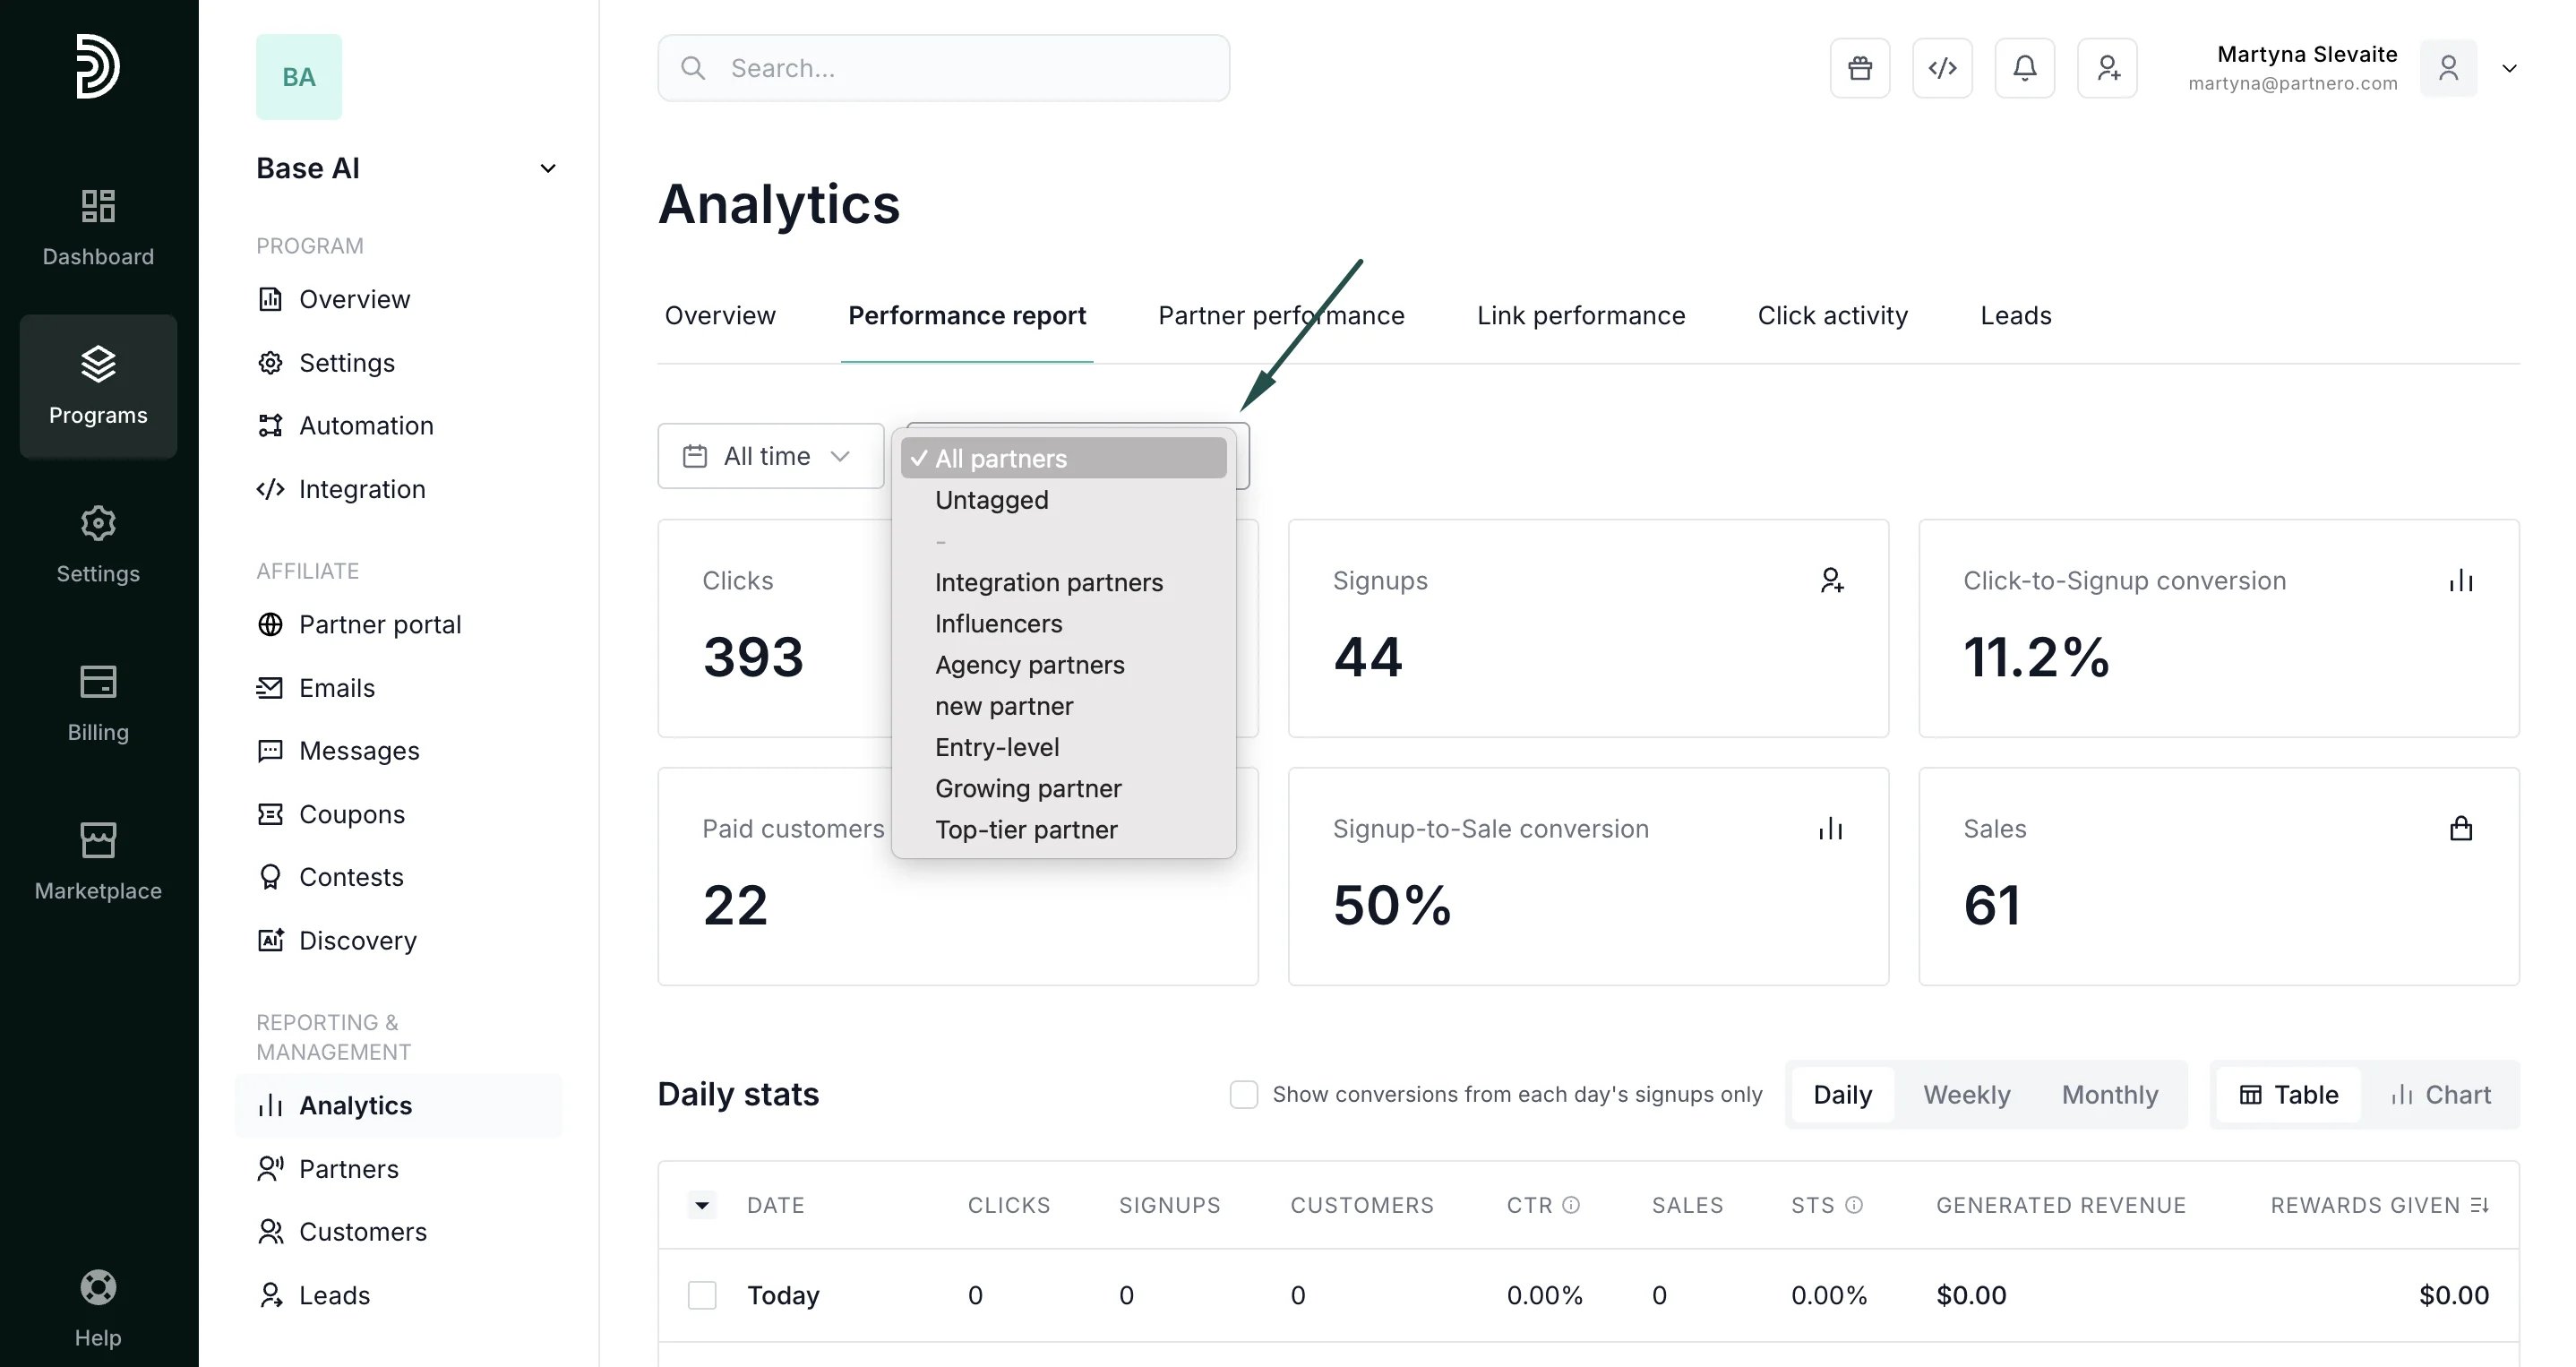 * **Clicks**: Total traffic driven by your affiliates. Measures reach and partner promotional activity.
* **Signups**: The number of referred visitors registered.
* **Click-to-Signup conversion**: Percentage of users who complete a registration after clicking an affiliate link. The first measurable conversion in your affiliate funnel.
* **Paid customers**: The number of unique paying customers attributed to affiliate referrals.
* **Signup-to-Sale conversion**: percentage of users who purchased a plan after signing up.
* **Sales**: Total number of transactions generated through your affiliate program.
***
### Daily stats
* **Clicks**: Total traffic driven by your affiliates. Measures reach and partner promotional activity.
* **Signups**: The number of referred visitors registered.
* **Click-to-Signup conversion**: Percentage of users who complete a registration after clicking an affiliate link. The first measurable conversion in your affiliate funnel.
* **Paid customers**: The number of unique paying customers attributed to affiliate referrals.
* **Signup-to-Sale conversion**: percentage of users who purchased a plan after signing up.
* **Sales**: Total number of transactions generated through your affiliate program.
***
### Daily stats
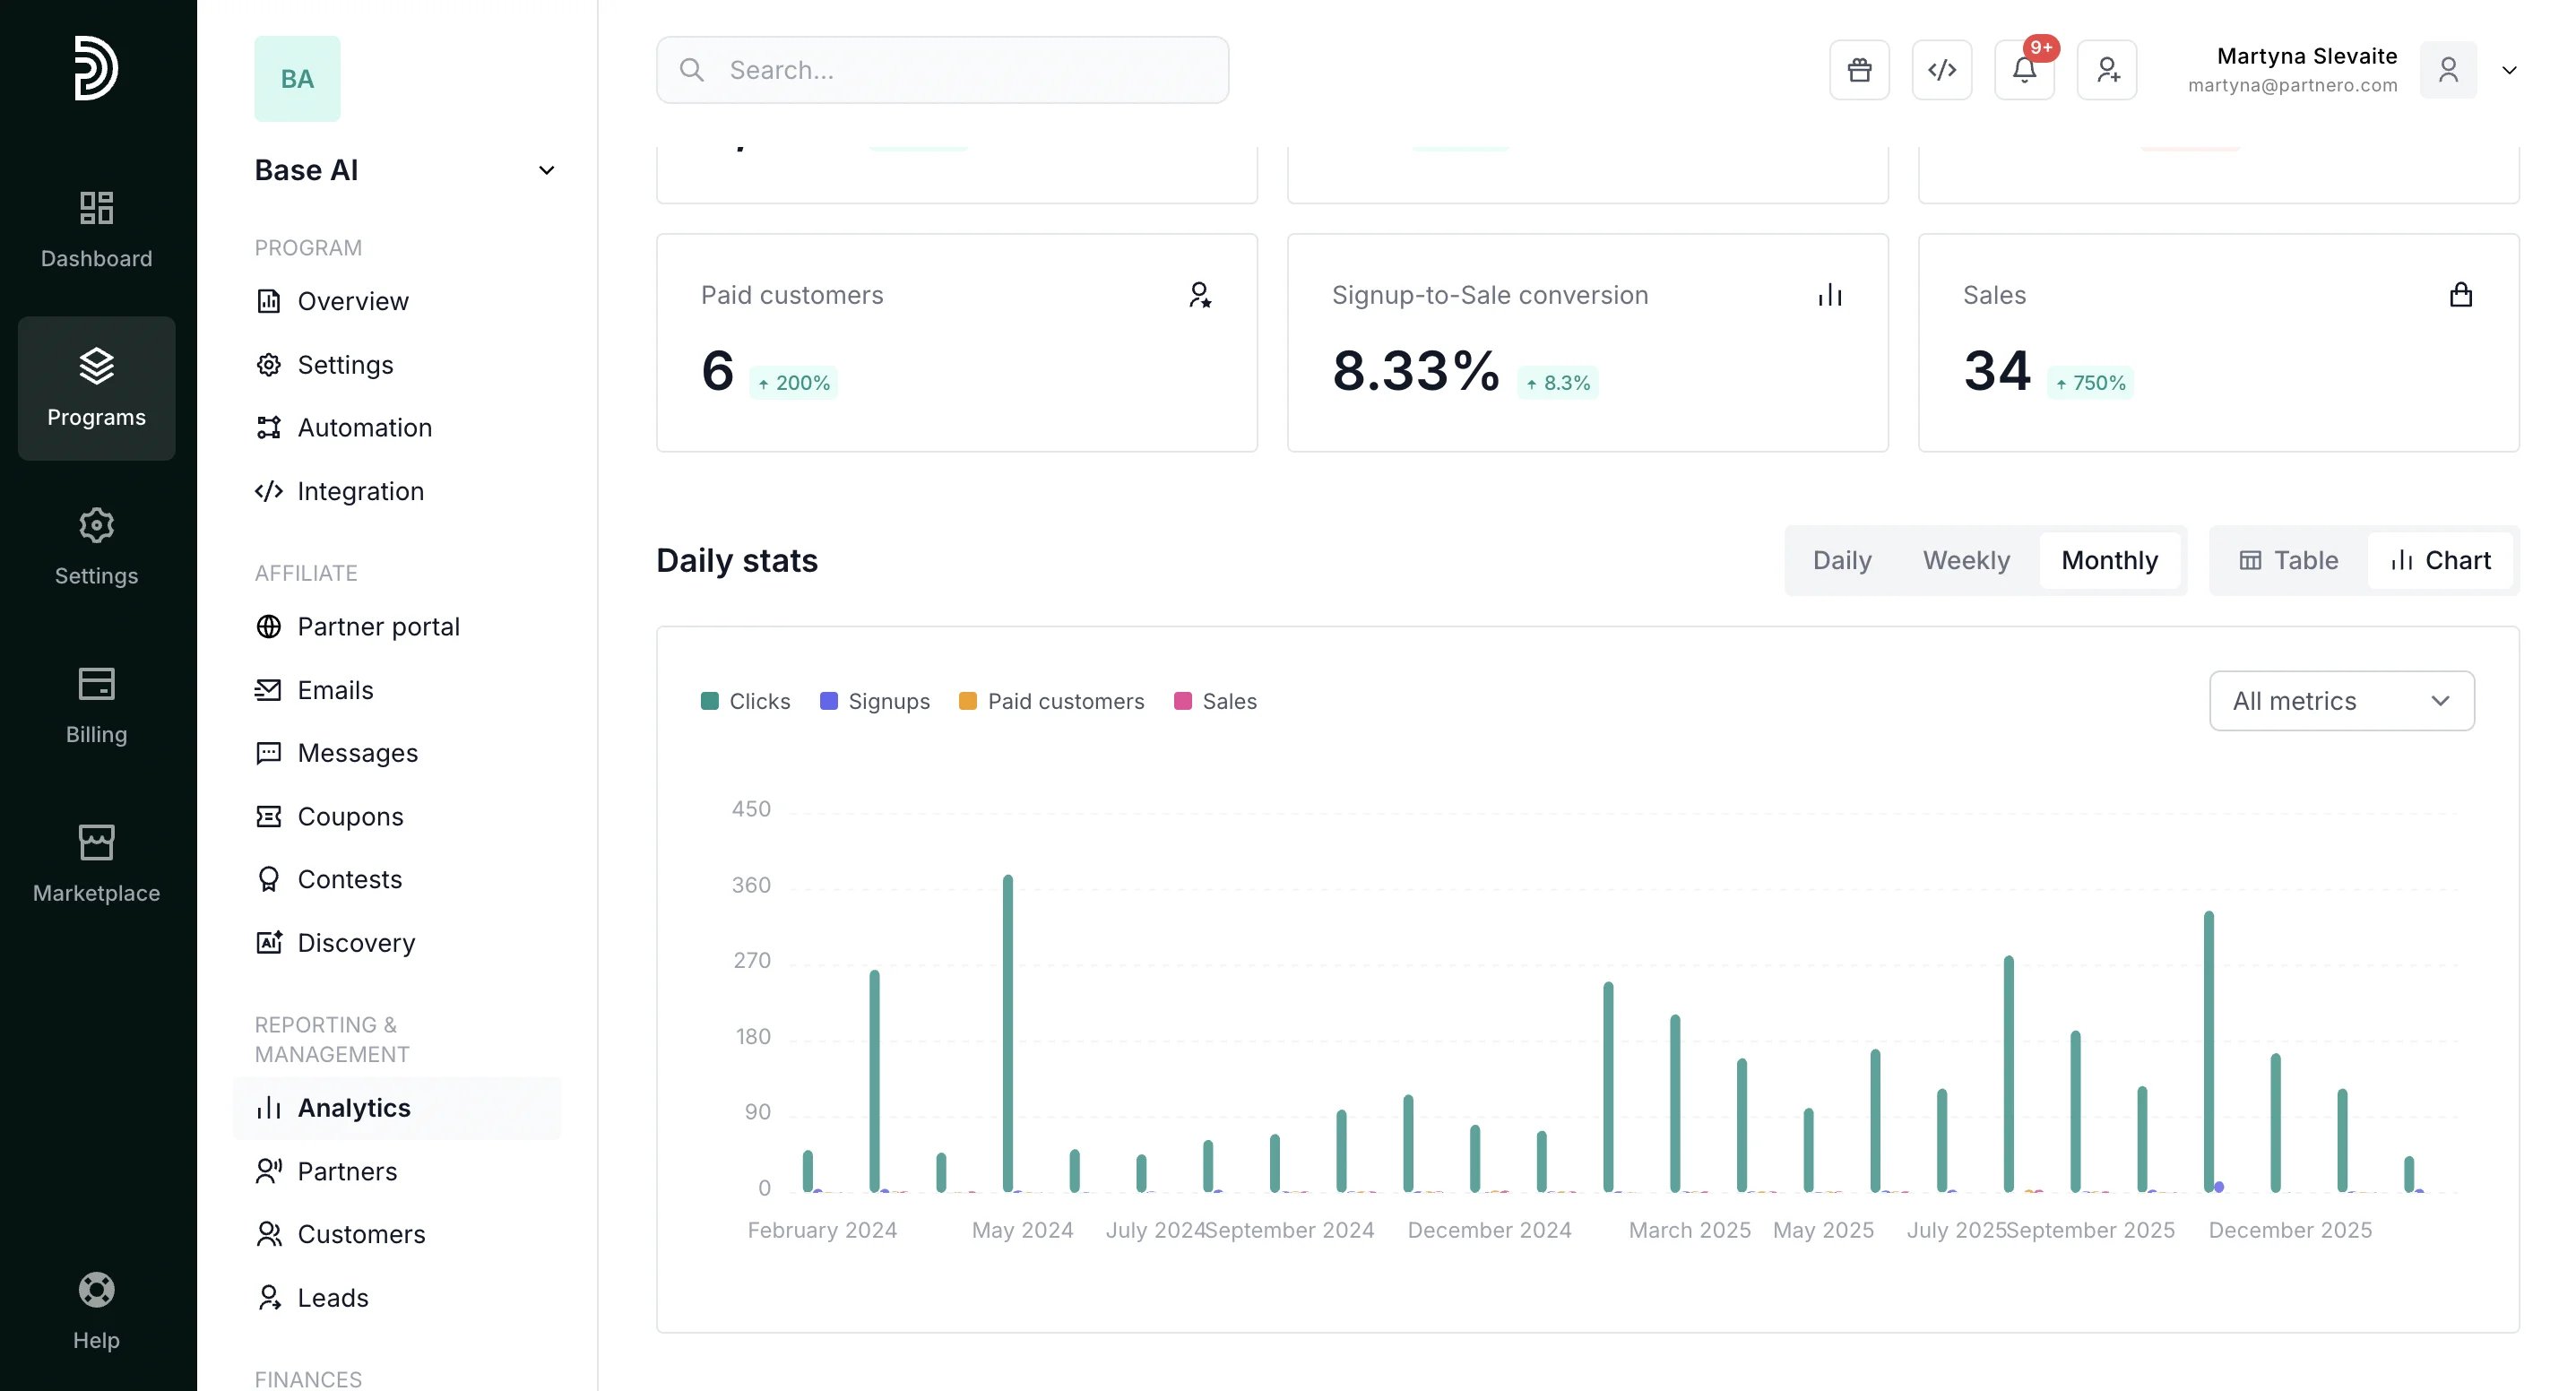 Charts and analysis tools:
* **Table or chart view**: switch between table and chart views.
* **All-metrics bar chart**: View clicks, signups, customers, and sales side by side in a single grouped bar chart. Spot correlations between traffic and conversions at a glance.
* **Single-metric chart**: Focus on one metric at a time for cleaner trend analysis.
Charts and analysis tools:
* **Table or chart view**: switch between table and chart views.
* **All-metrics bar chart**: View clicks, signups, customers, and sales side by side in a single grouped bar chart. Spot correlations between traffic and conversions at a glance.
* **Single-metric chart**: Focus on one metric at a time for cleaner trend analysis.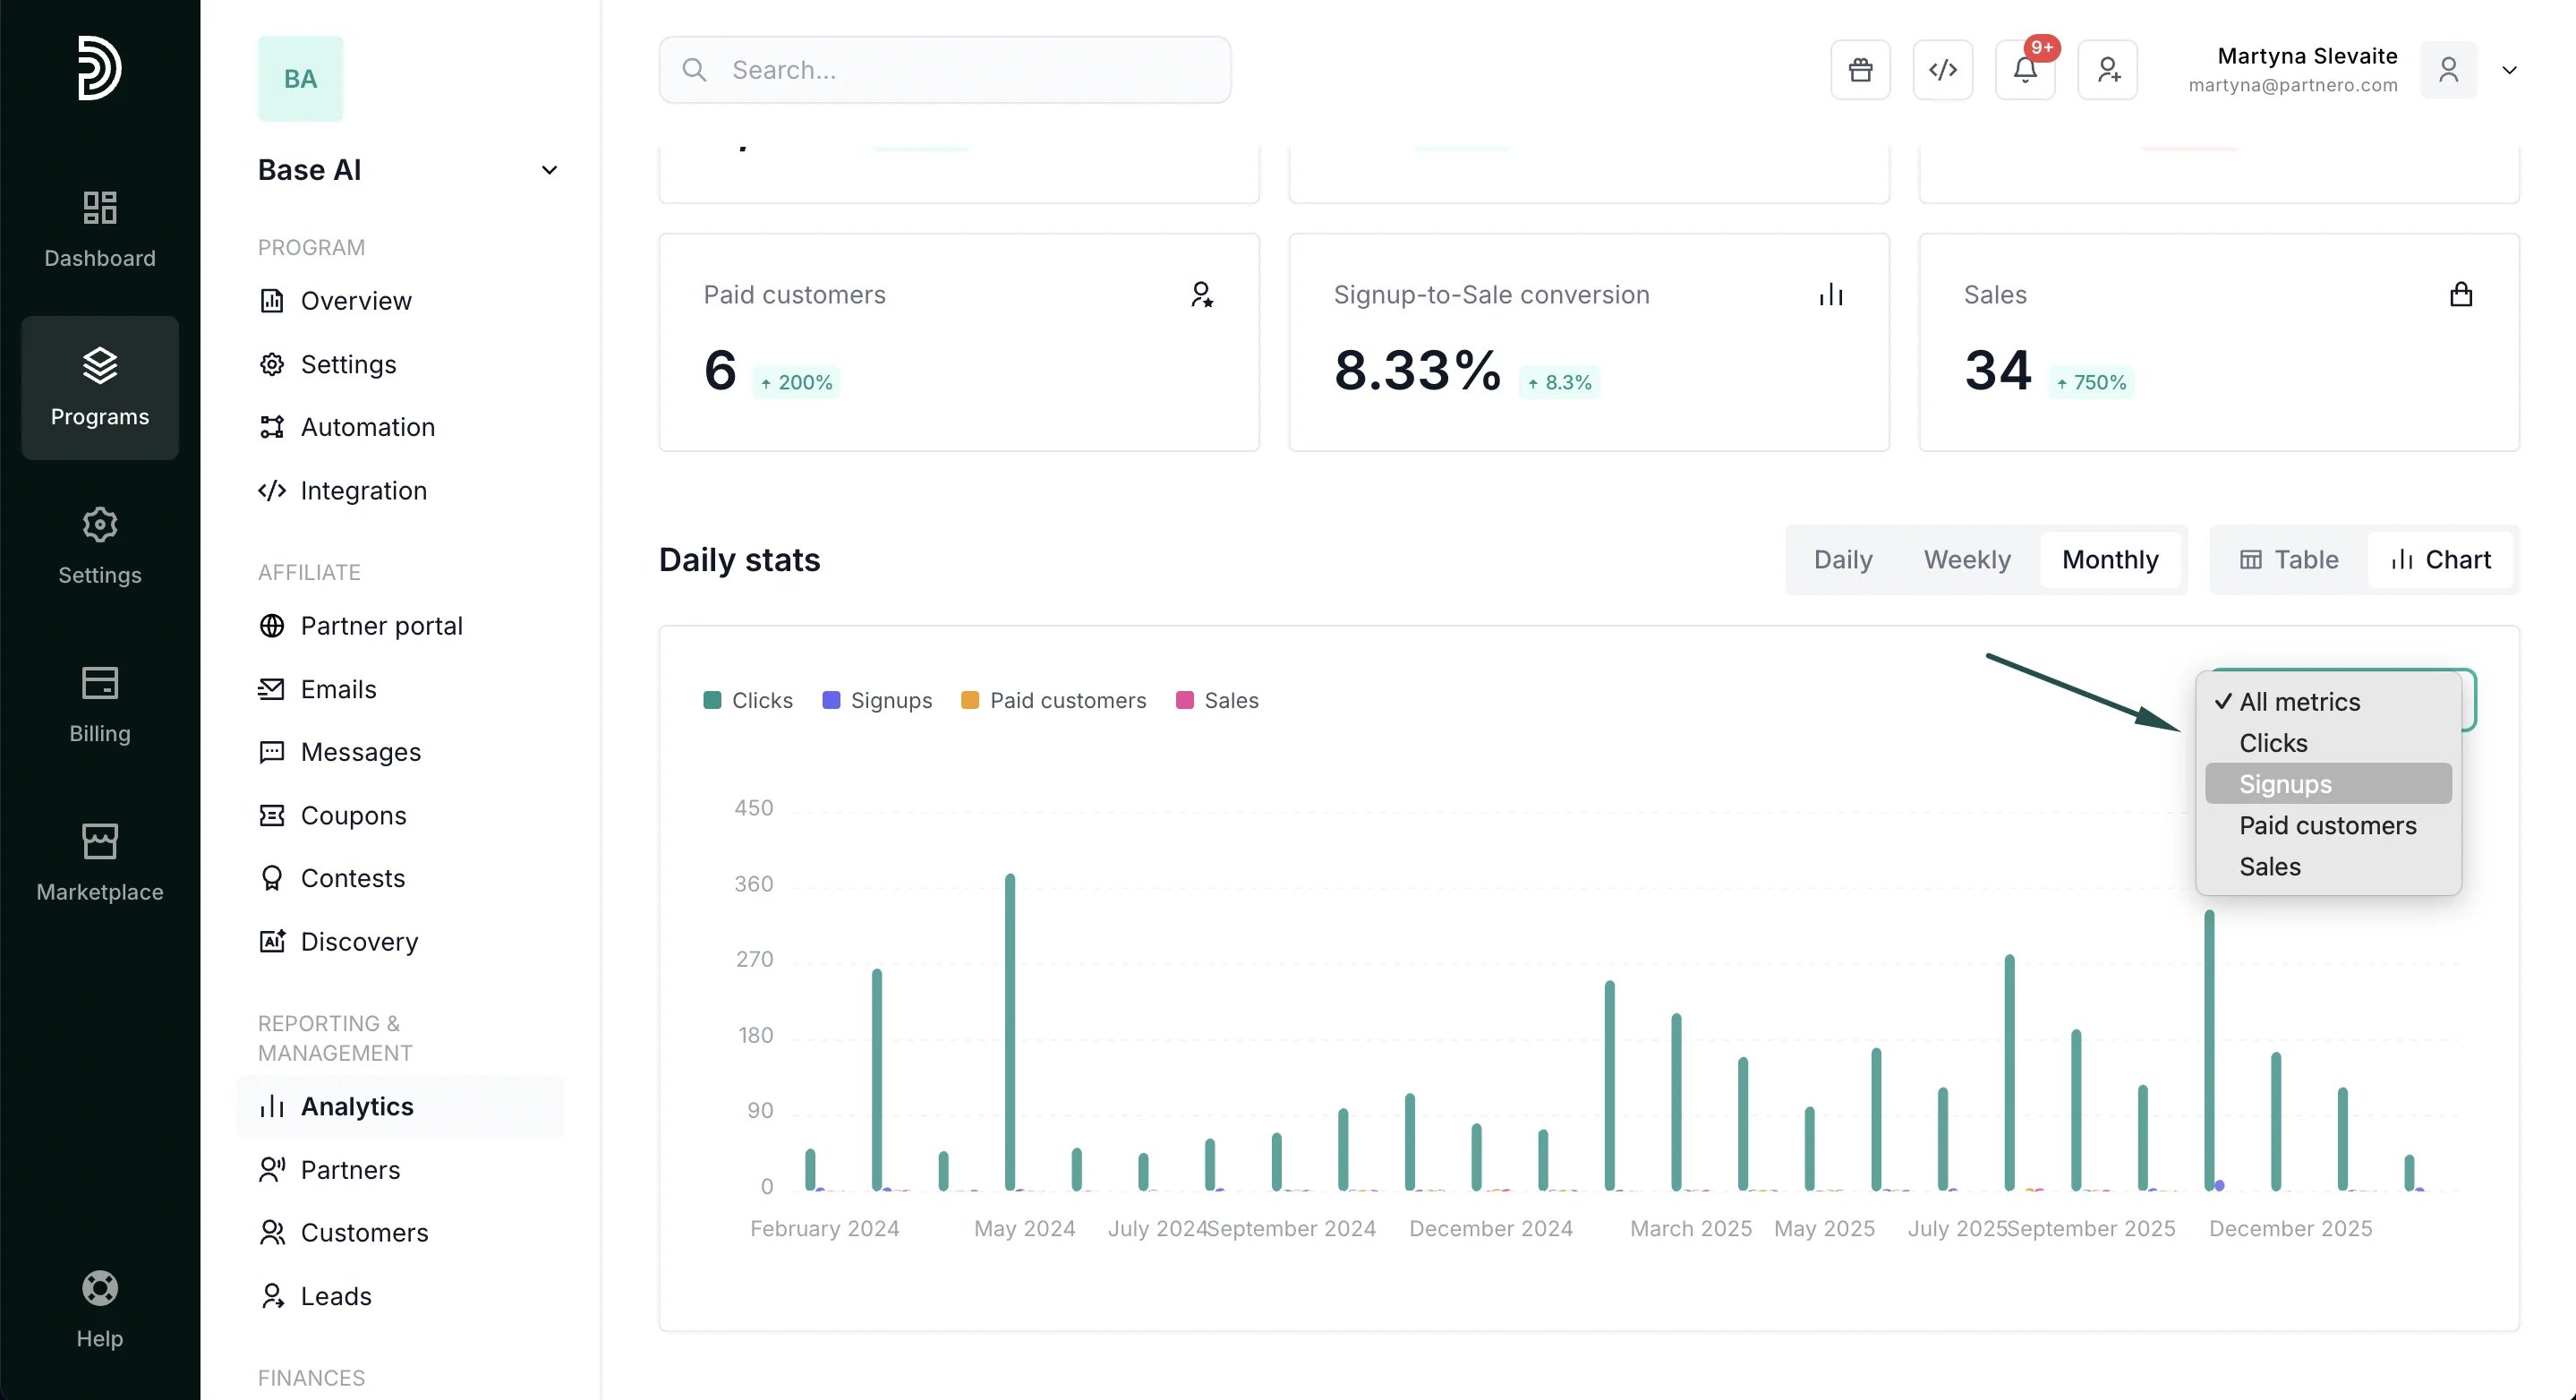 * **Daily, weekly, or monthly grouping**: Switch between granularities to find daily anomalies or long-term trends.
* **"Attributed to signups" toggle**: Isolate conversions and revenue from each period's new signups only. Reveals the true acquisition value of each cohort without mixing in revenue from older customers. Available in **Table view** only.
* **Daily, weekly, or monthly grouping**: Switch between granularities to find daily anomalies or long-term trends.
* **"Attributed to signups" toggle**: Isolate conversions and revenue from each period's new signups only. Reveals the true acquisition value of each cohort without mixing in revenue from older customers. Available in **Table view** only. 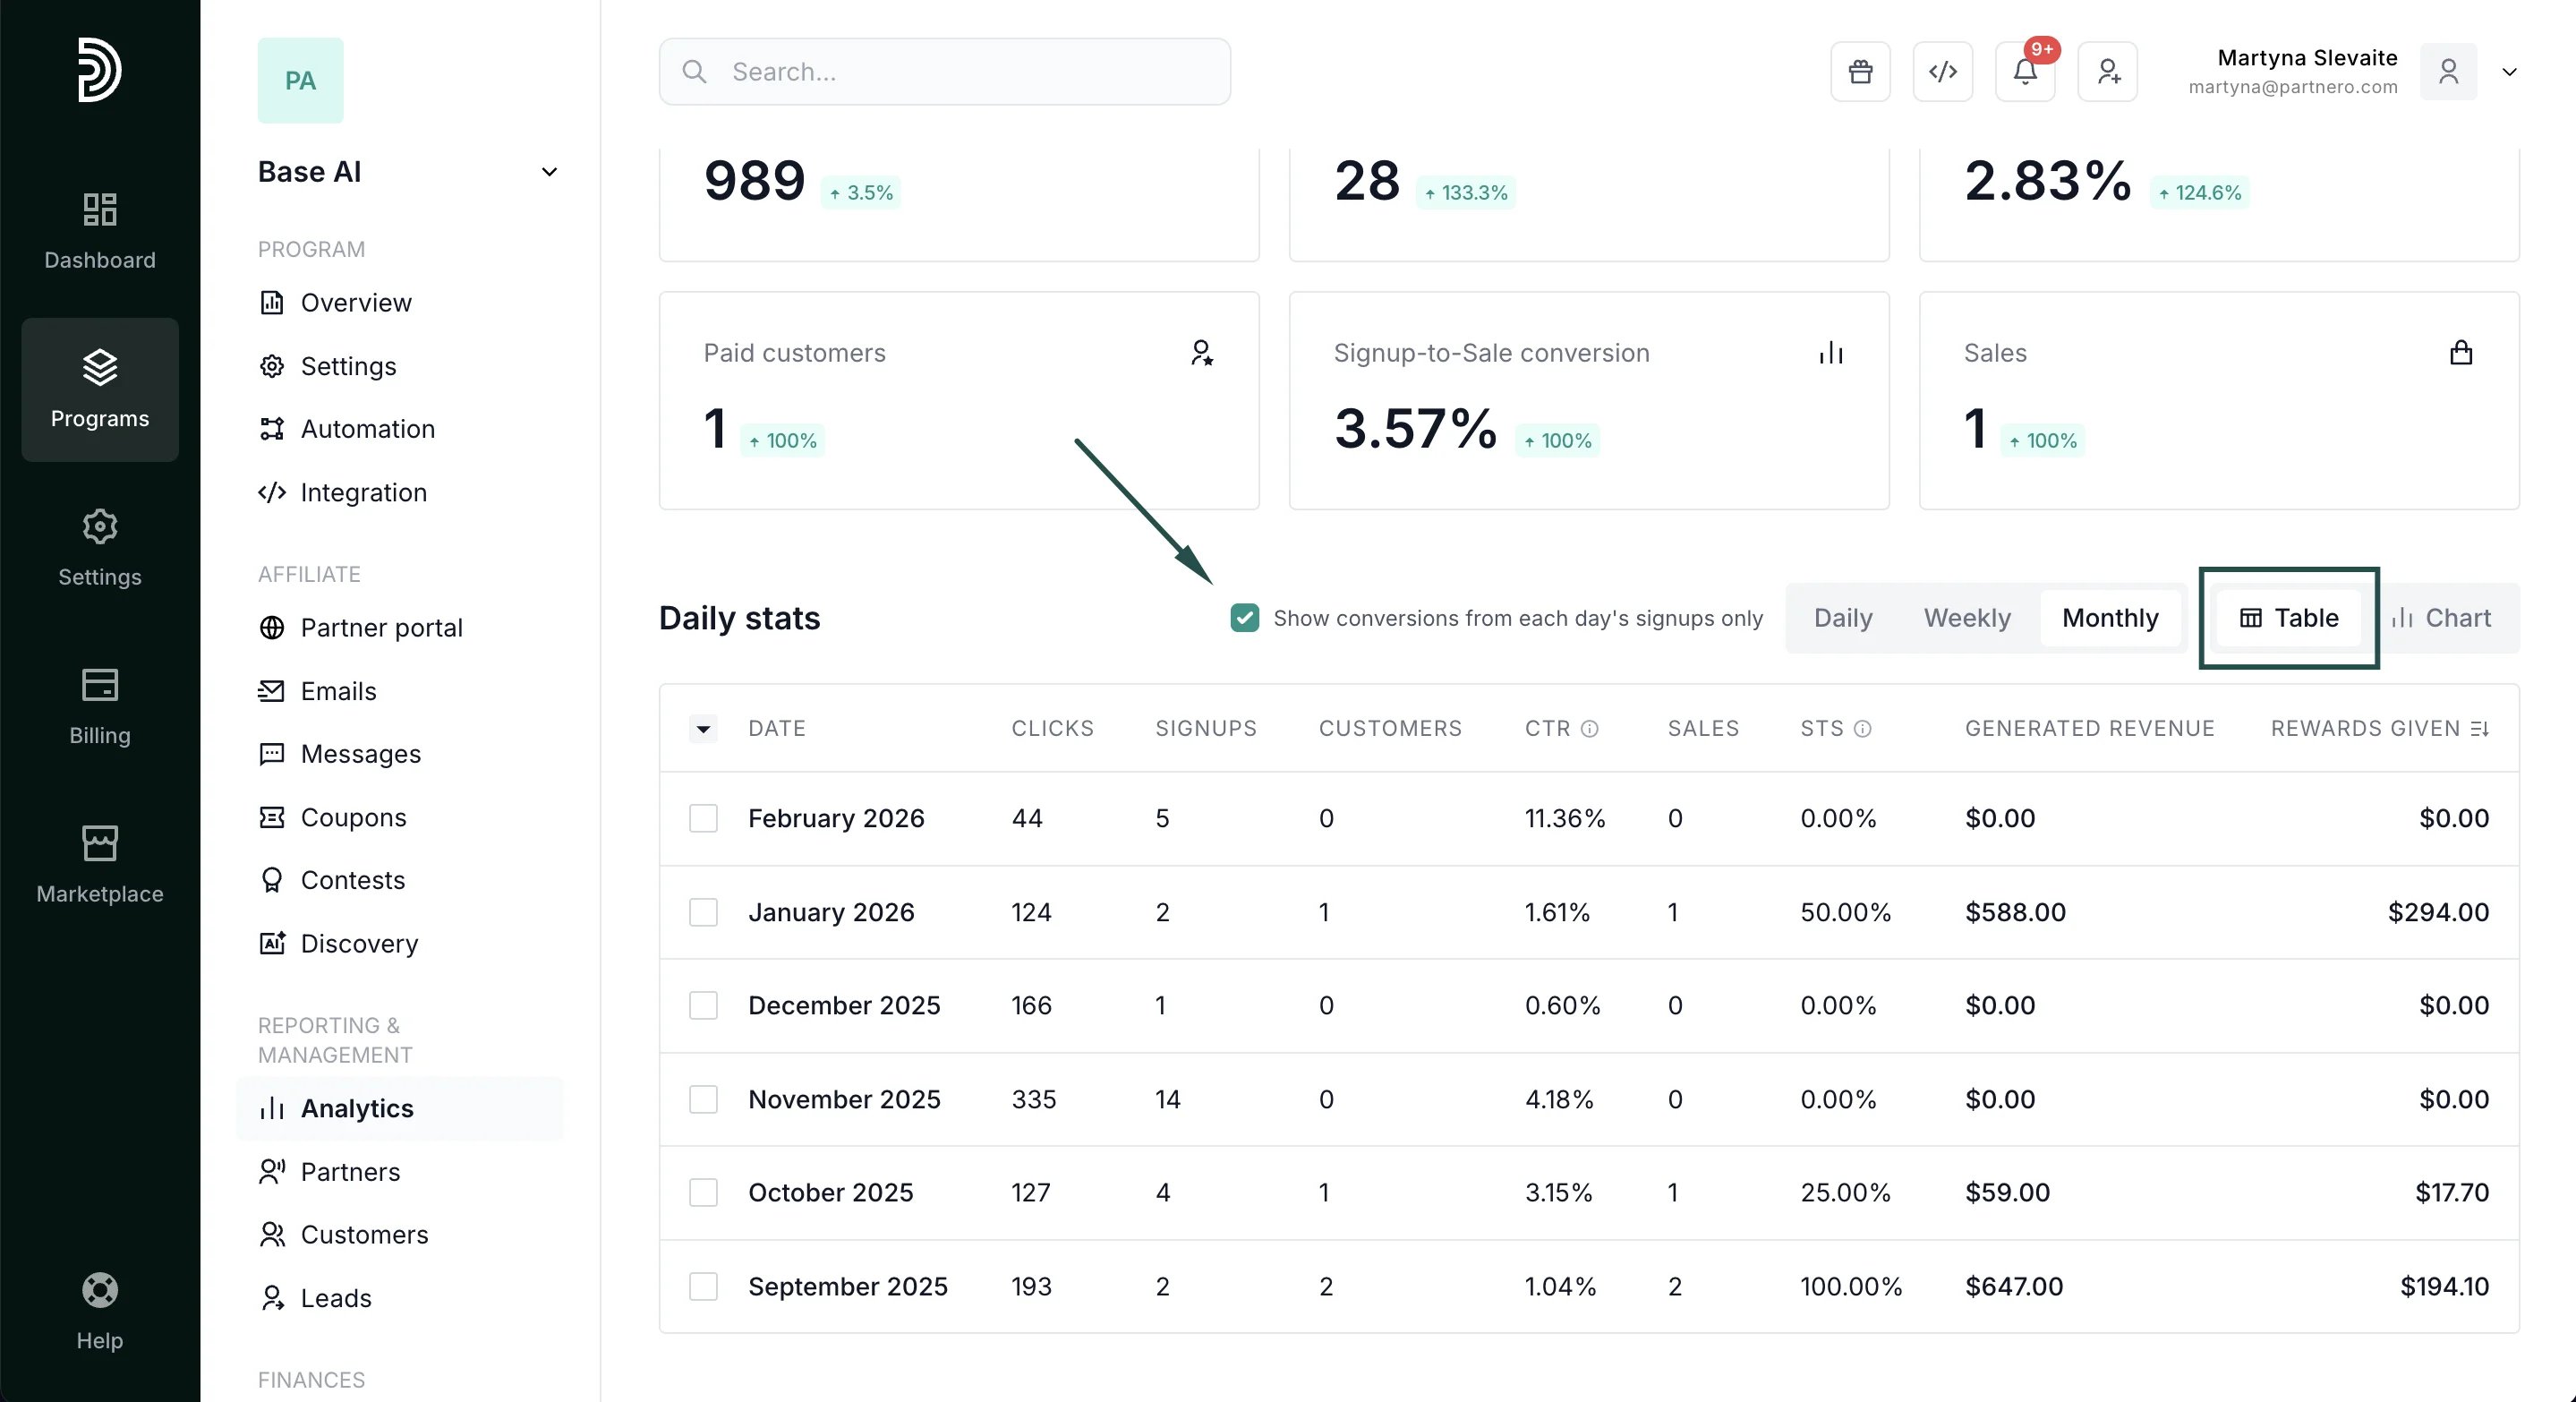 Detailed data table:
* 10 columns: Date, Clicks, Signups, Customers, Click-to-Signup rate, Sales, Signup-to-Sale rate, Generated revenue, Rewards given.
* Fully sortable, paginated, and exportable for external reporting or partner reviews.
Detailed data table:
* 10 columns: Date, Clicks, Signups, Customers, Click-to-Signup rate, Sales, Signup-to-Sale rate, Generated revenue, Rewards given.
* Fully sortable, paginated, and exportable for external reporting or partner reviews. 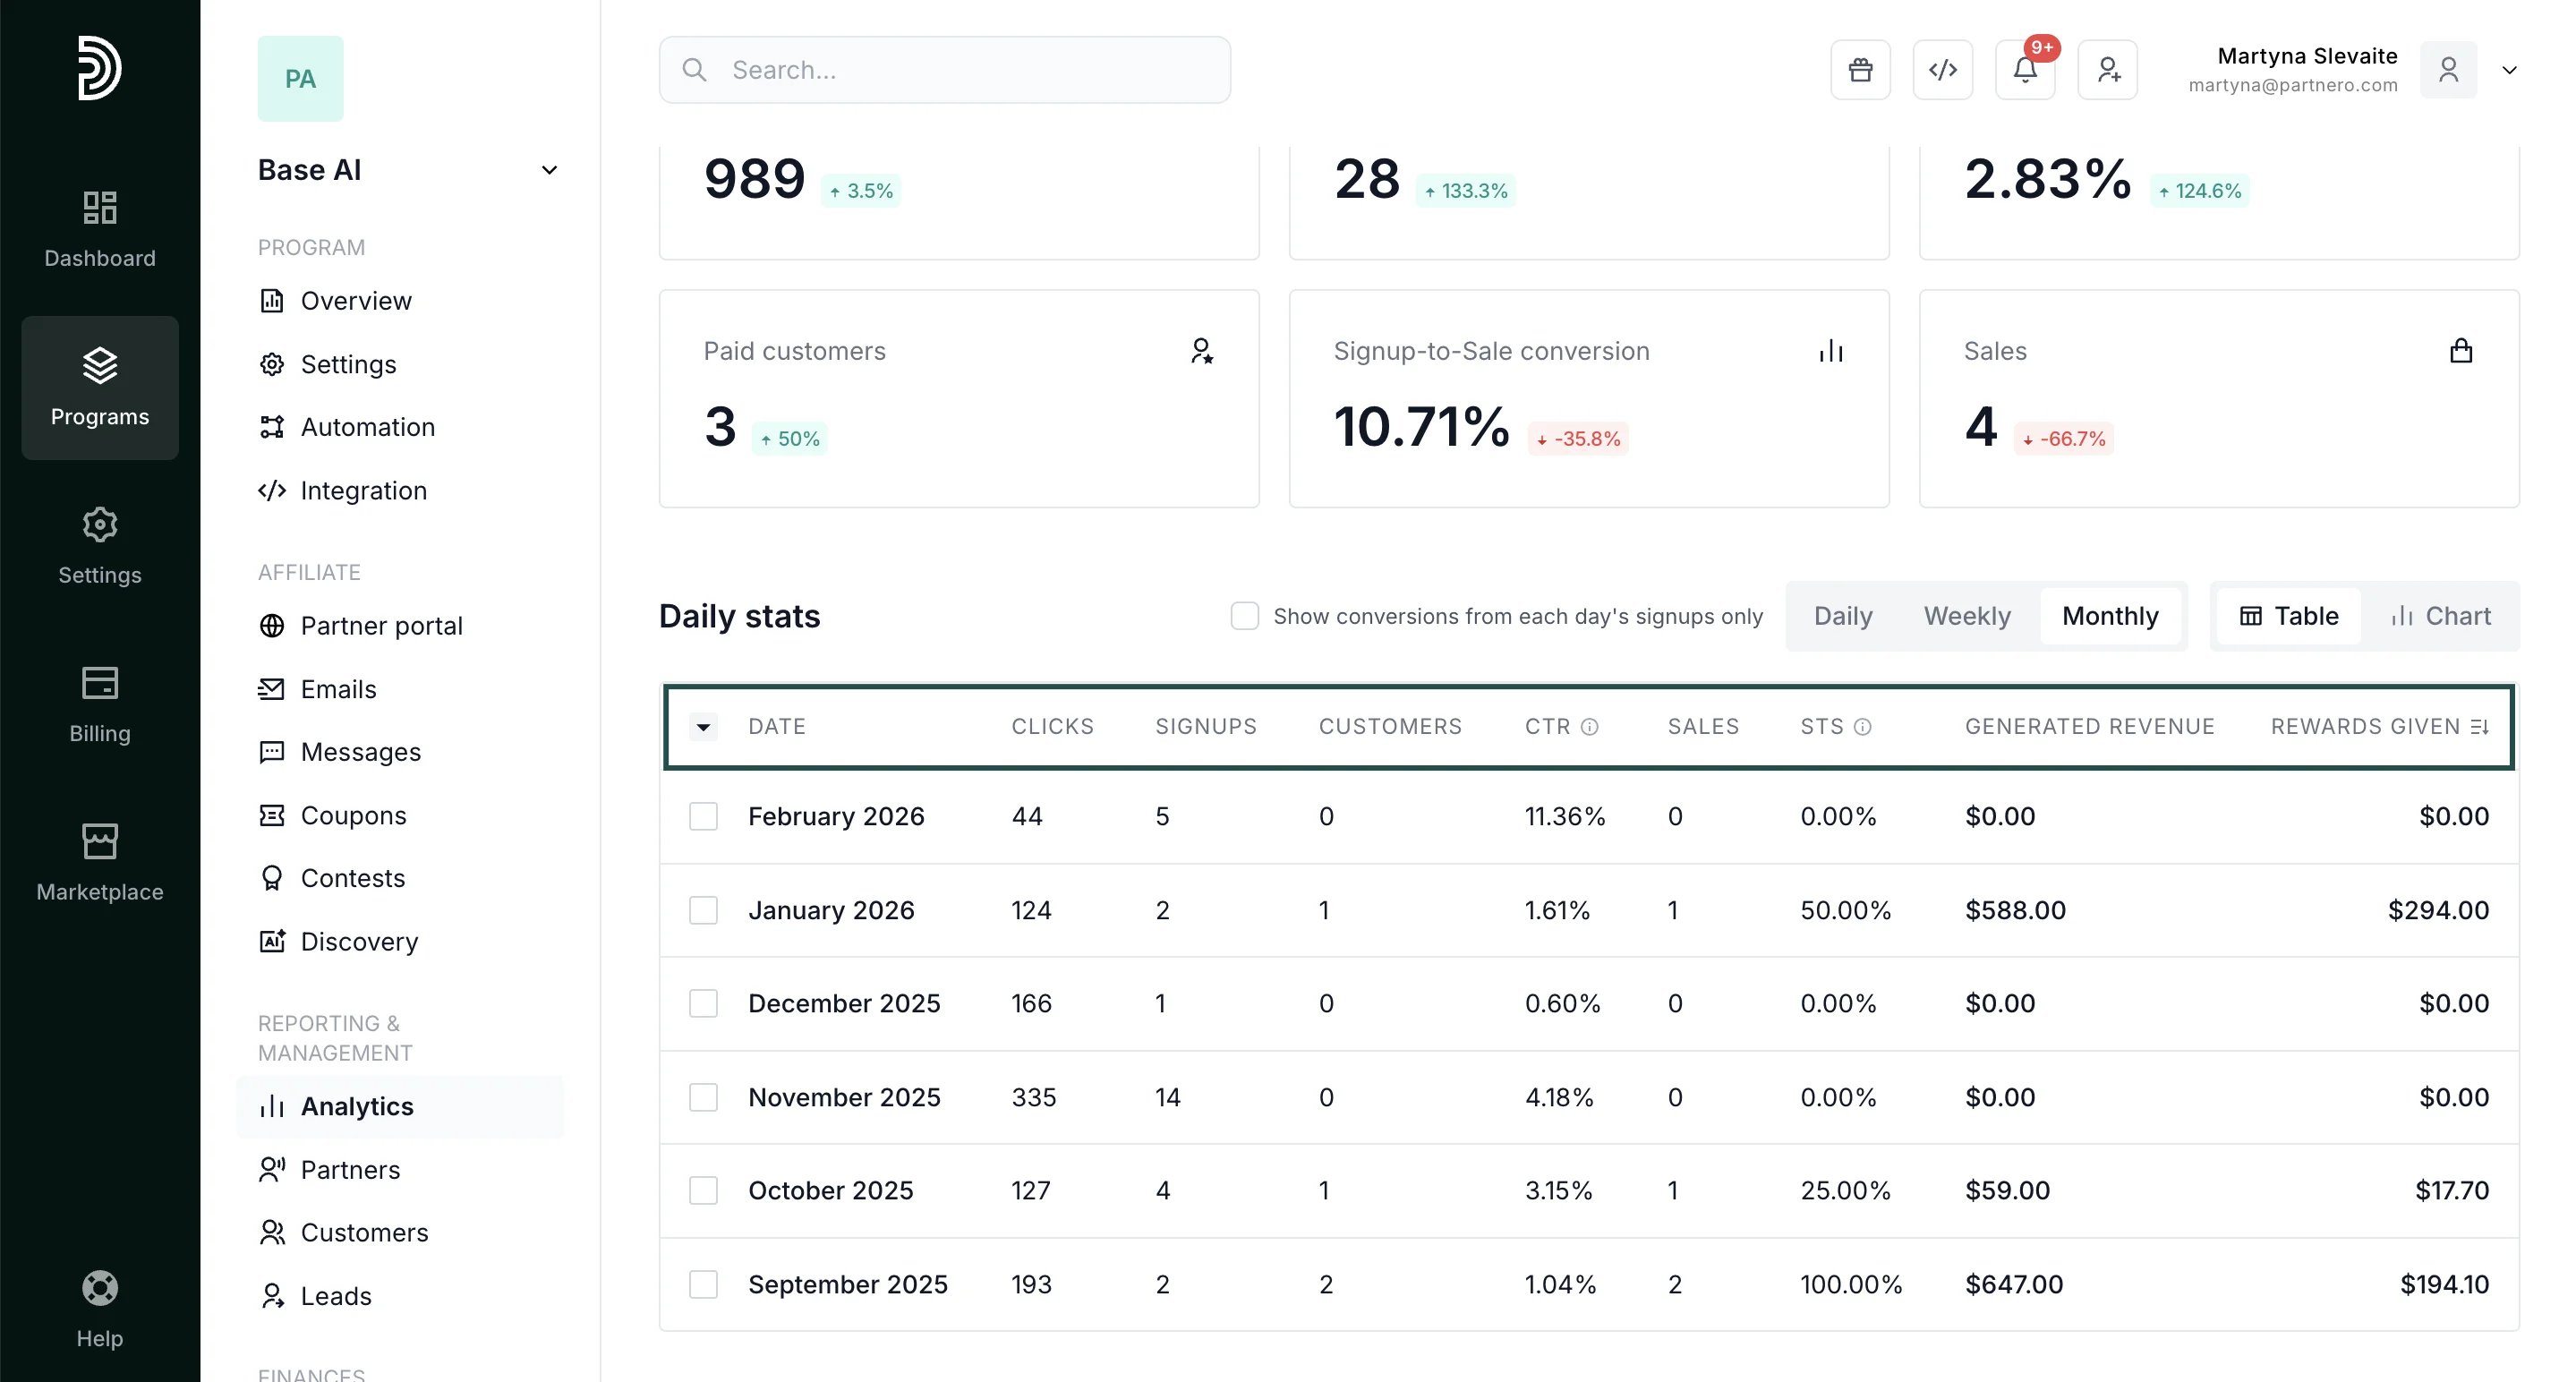 ***
#### Continue reading about analytics
Explore other analytics reports to better understand your performance and optimize your partner program:
* [Analytics Overview](/knowledge-base/analytics-reporting/analytics-overview) – High-level dashboard summary of your program’s performance
* [Partner Performance](/knowledge-base/analytics-reporting/partner-performance) – Compare and evaluate individual partner results
* [Link Performance](/knowledge-base/analytics-reporting/link-performance) – Analyze how individual tracking links are performing
* [Click Activity](/knowledge-base/analytics-reporting/click-activity) – Review detailed click-level data and traffic insights
* [Lead Analytics](/knowledge-base/analytics-reporting/lead-analytics-overview) – Monitor lead acquisition trends and quality
This documentation is built and hosted on [Mintlify](https://mintlify.com), a developer documentation platform.
***
#### Continue reading about analytics
Explore other analytics reports to better understand your performance and optimize your partner program:
* [Analytics Overview](/knowledge-base/analytics-reporting/analytics-overview) – High-level dashboard summary of your program’s performance
* [Partner Performance](/knowledge-base/analytics-reporting/partner-performance) – Compare and evaluate individual partner results
* [Link Performance](/knowledge-base/analytics-reporting/link-performance) – Analyze how individual tracking links are performing
* [Click Activity](/knowledge-base/analytics-reporting/click-activity) – Review detailed click-level data and traffic insights
* [Lead Analytics](/knowledge-base/analytics-reporting/lead-analytics-overview) – Monitor lead acquisition trends and quality
This documentation is built and hosted on [Mintlify](https://mintlify.com), a developer documentation platform.